Reference table
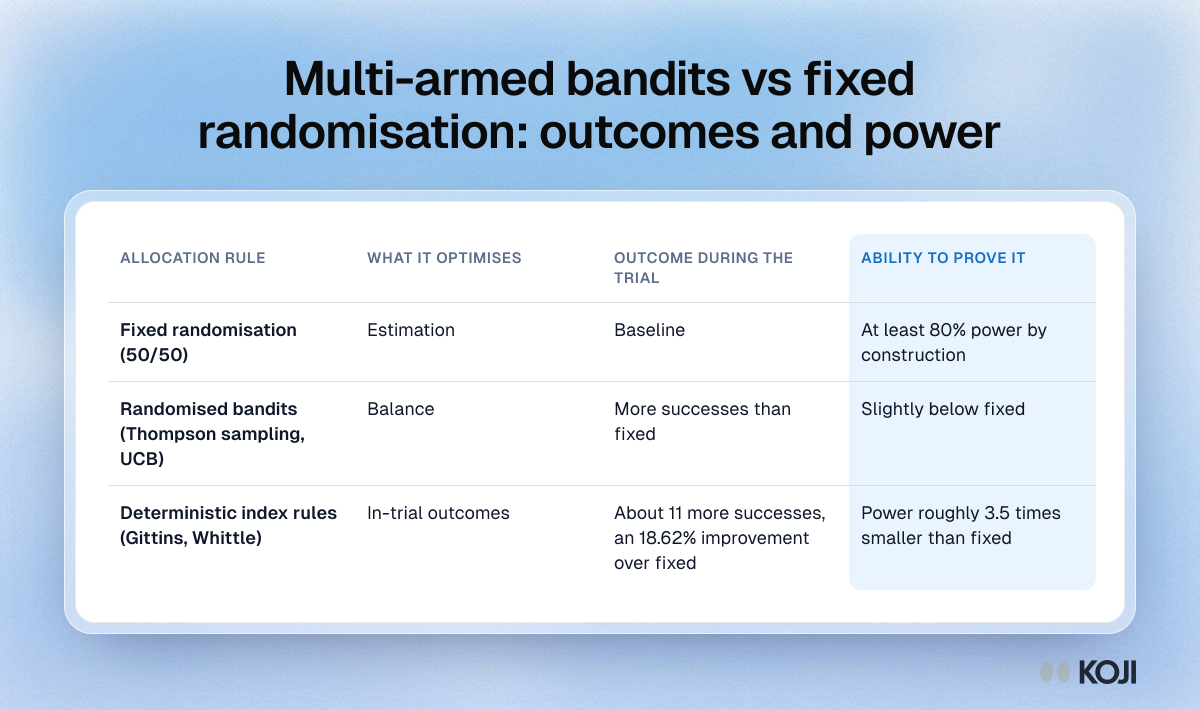
Multi-armed bandits vs fixed randomisation: outcomes and power
A two-arm trial of 148 participants, 30% vs 50% true success rates, sized for 80% power
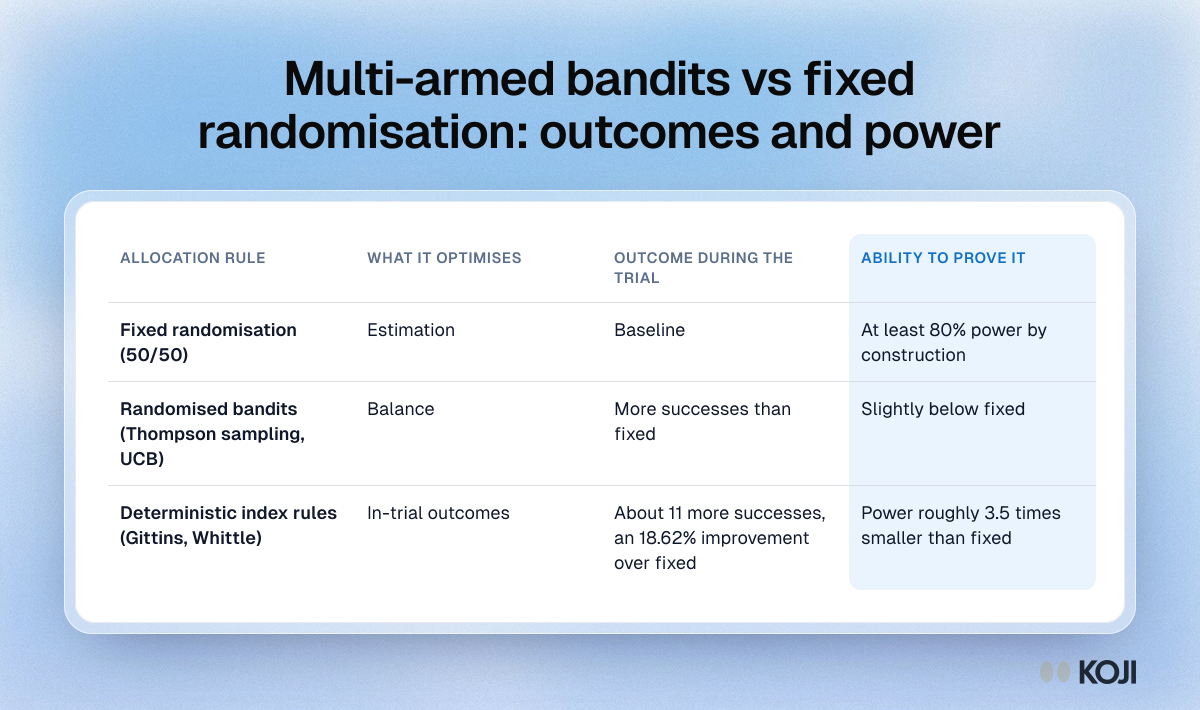
A table from Villar, Bowden and Wason's simulation of a two-arm clinical trial, comparing fixed 50/50 randomisation with randomised bandits and deterministic index rules. The Gittins and Whittle designs treat about 11 more participants successfully, but end with power roughly 3.5 times smaller than the fixed design. Use it when a team proposes a bandit for a test whose effect size someone will need later. Pair the experiment with interviews in Koji to learn why the losing arm lost.
Where this appears
What's in this reference table
| Allocation rule | What it optimises | Outcome during the trial | Ability to prove it |
|---|---|---|---|
| Fixed randomisation (50/50) | Estimation | Baseline | At least 80% power by construction |
| Randomised bandits (Thompson sampling, UCB) | Balance | More successes than fixed | Slightly below fixed |
| Deterministic index rules (Gittins, Whittle) | In-trial outcomes | About 11 more successes, an 18.62% improvement over fixed | Power roughly 3.5 times smaller than fixed |
Use this image
Free to use in your docs, decks and posts under CC BY 4.0, as long as you credit Koji with a link to this page. To embed it, paste this into your page:
html
<a href="https://www.koji.so/visuals/bandit-allocation-rules-outcomes-vs-statistical-power"><img src="https://www.koji.so/visuals/bandit-allocation-rules-outcomes-vs-statistical-power/bandit-allocation-rules-outcomes-vs-statistical-power.png" alt="Table comparing allocation rules: fixed 50/50 keeps 80% power, while Gittins and Whittle bandits gain about 11 successes with power 3.5 times smaller." width="1200" height="710" /></a>
<p>Source: <a href="https://www.koji.so/visuals/bandit-allocation-rules-outcomes-vs-statistical-power">Multi-armed bandits vs fixed randomisation: outcomes and power</a>, Koji</p>