Bar chart
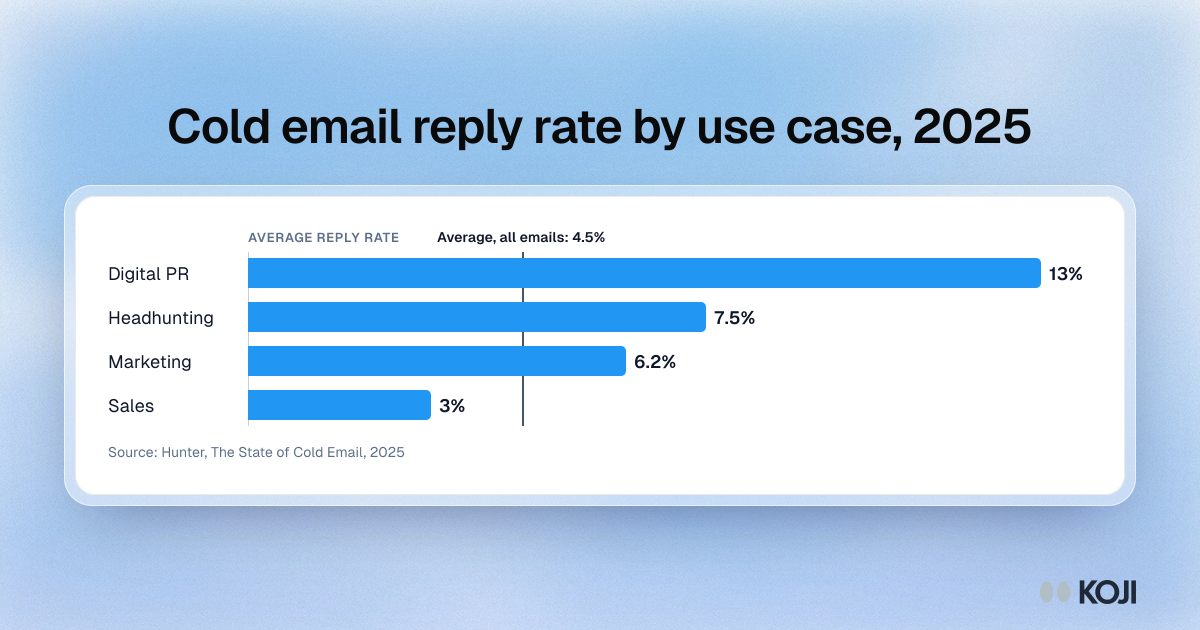
Cold email reply rate by use case, 2025
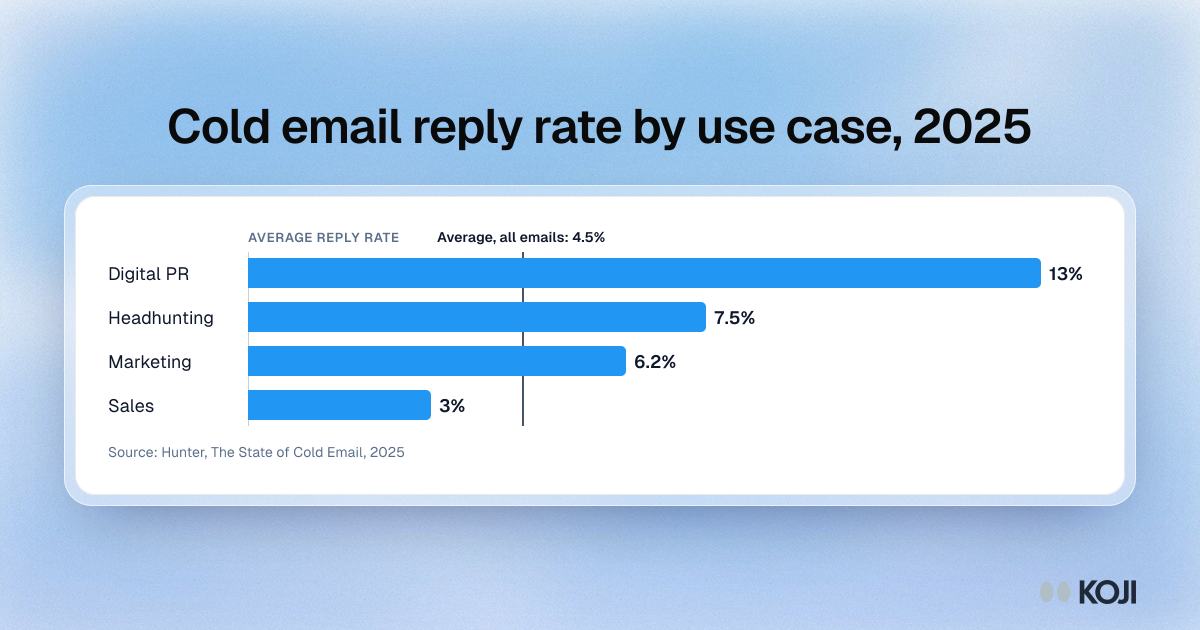
Average reply rates for cold email sequences in 2025, split by what the email was for: digital PR, headhunting, marketing and sales, against the overall average of 4.5%. The figures come from Hunter, which analysed 31 million cold emails sent by its users. Researchers can use them to size a recruitment batch when inviting people who have never heard of them. Koji lets you invite the people you pick and run the interviews without scheduling.
Where this appears
What's in this bar chart
| Average reply rate | |
|---|---|
| Digital PR | 13% |
| Headhunting | 7.5% |
| Marketing | 6.2% |
| Sales | 3% |
Reference line: Average, all emails, 4.5%.
Use this image
Free to use in your docs, decks and posts under CC BY 4.0, as long as you credit Koji with a link to this page. To embed it, paste this into your page:
html
<a href="https://www.koji.so/visuals/cold-email-reply-rate-by-use-case-2025"><img src="https://www.koji.so/visuals/cold-email-reply-rate-by-use-case-2025/cold-email-reply-rate-by-use-case-2025.png" alt="Bar chart of average cold email reply rates by use case in 2025: digital PR 13%, headhunting 7.5%, marketing 6.2% and sales 3%, against a 4.5% average." width="1200" height="630" /></a>
<p>Source: <a href="https://www.koji.so/visuals/cold-email-reply-rate-by-use-case-2025">Cold email reply rate by use case, 2025</a>, Koji</p>