Flowchart
Which course evaluation reporting setup fits?
For quality and teaching and learning teams comparing course evaluation reporting tools
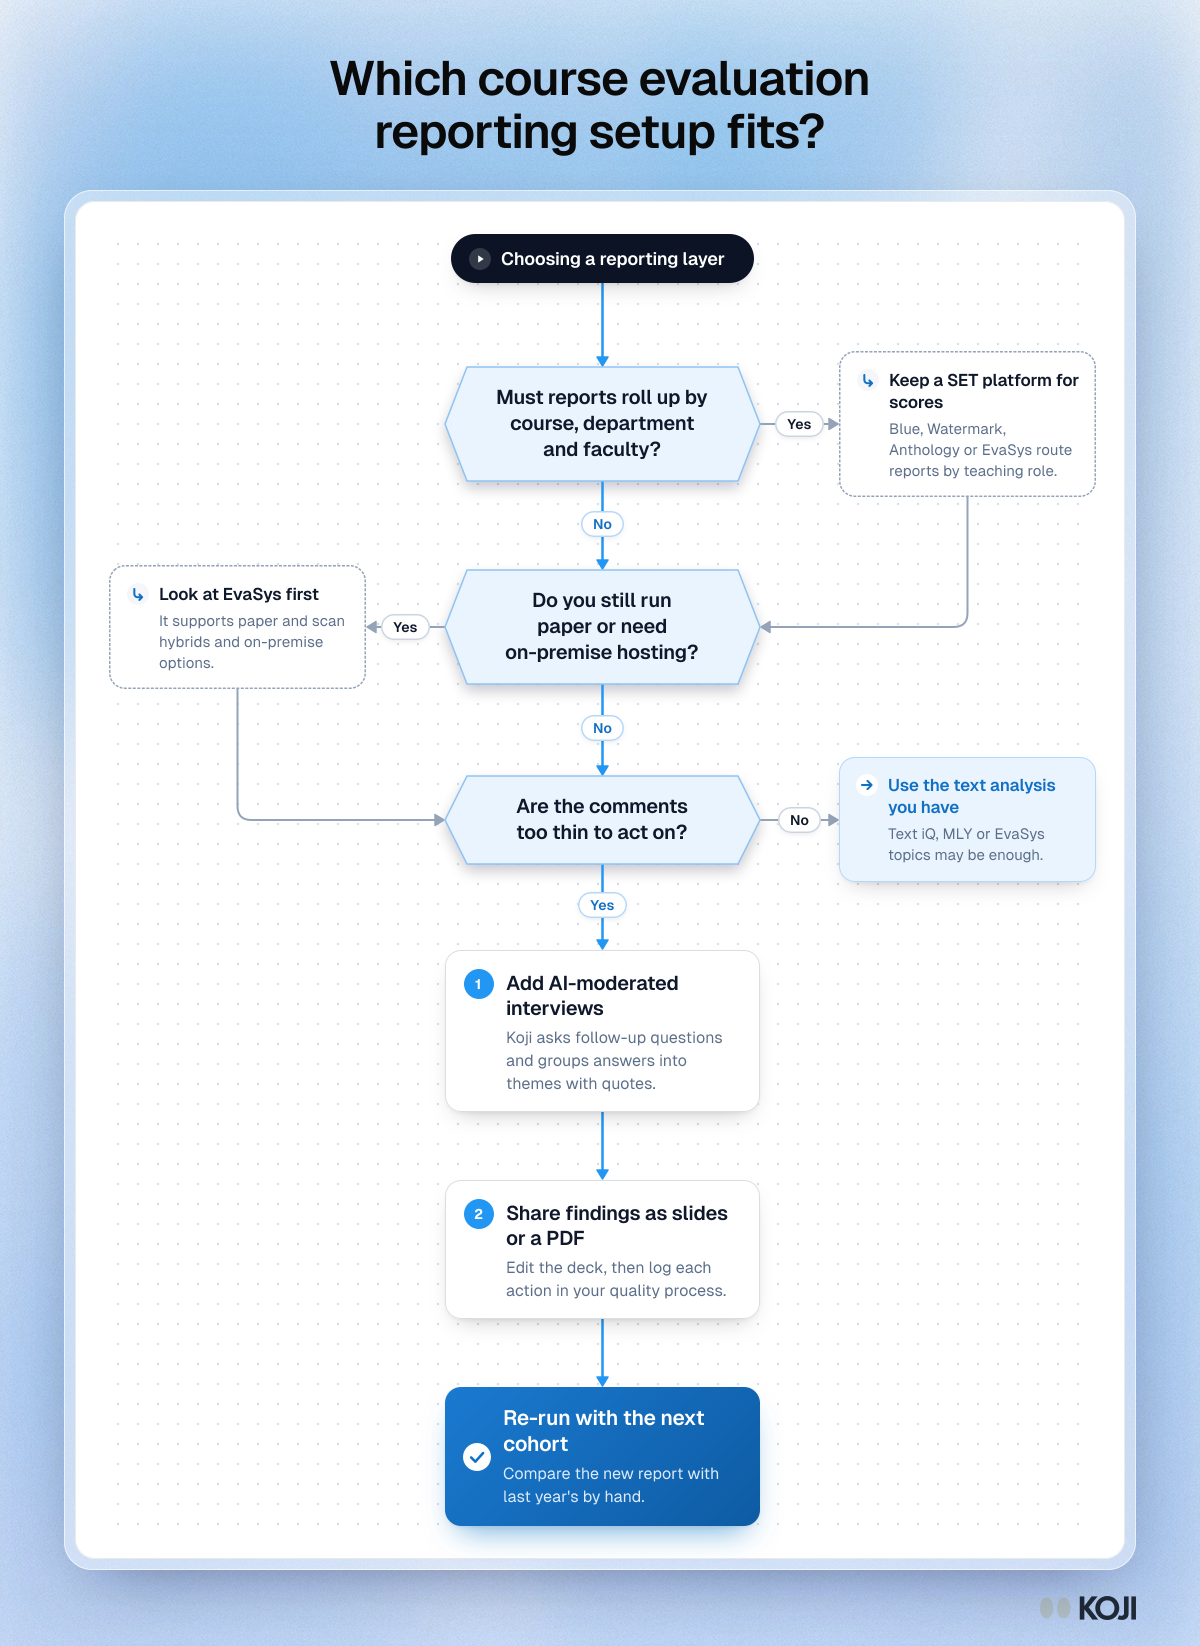
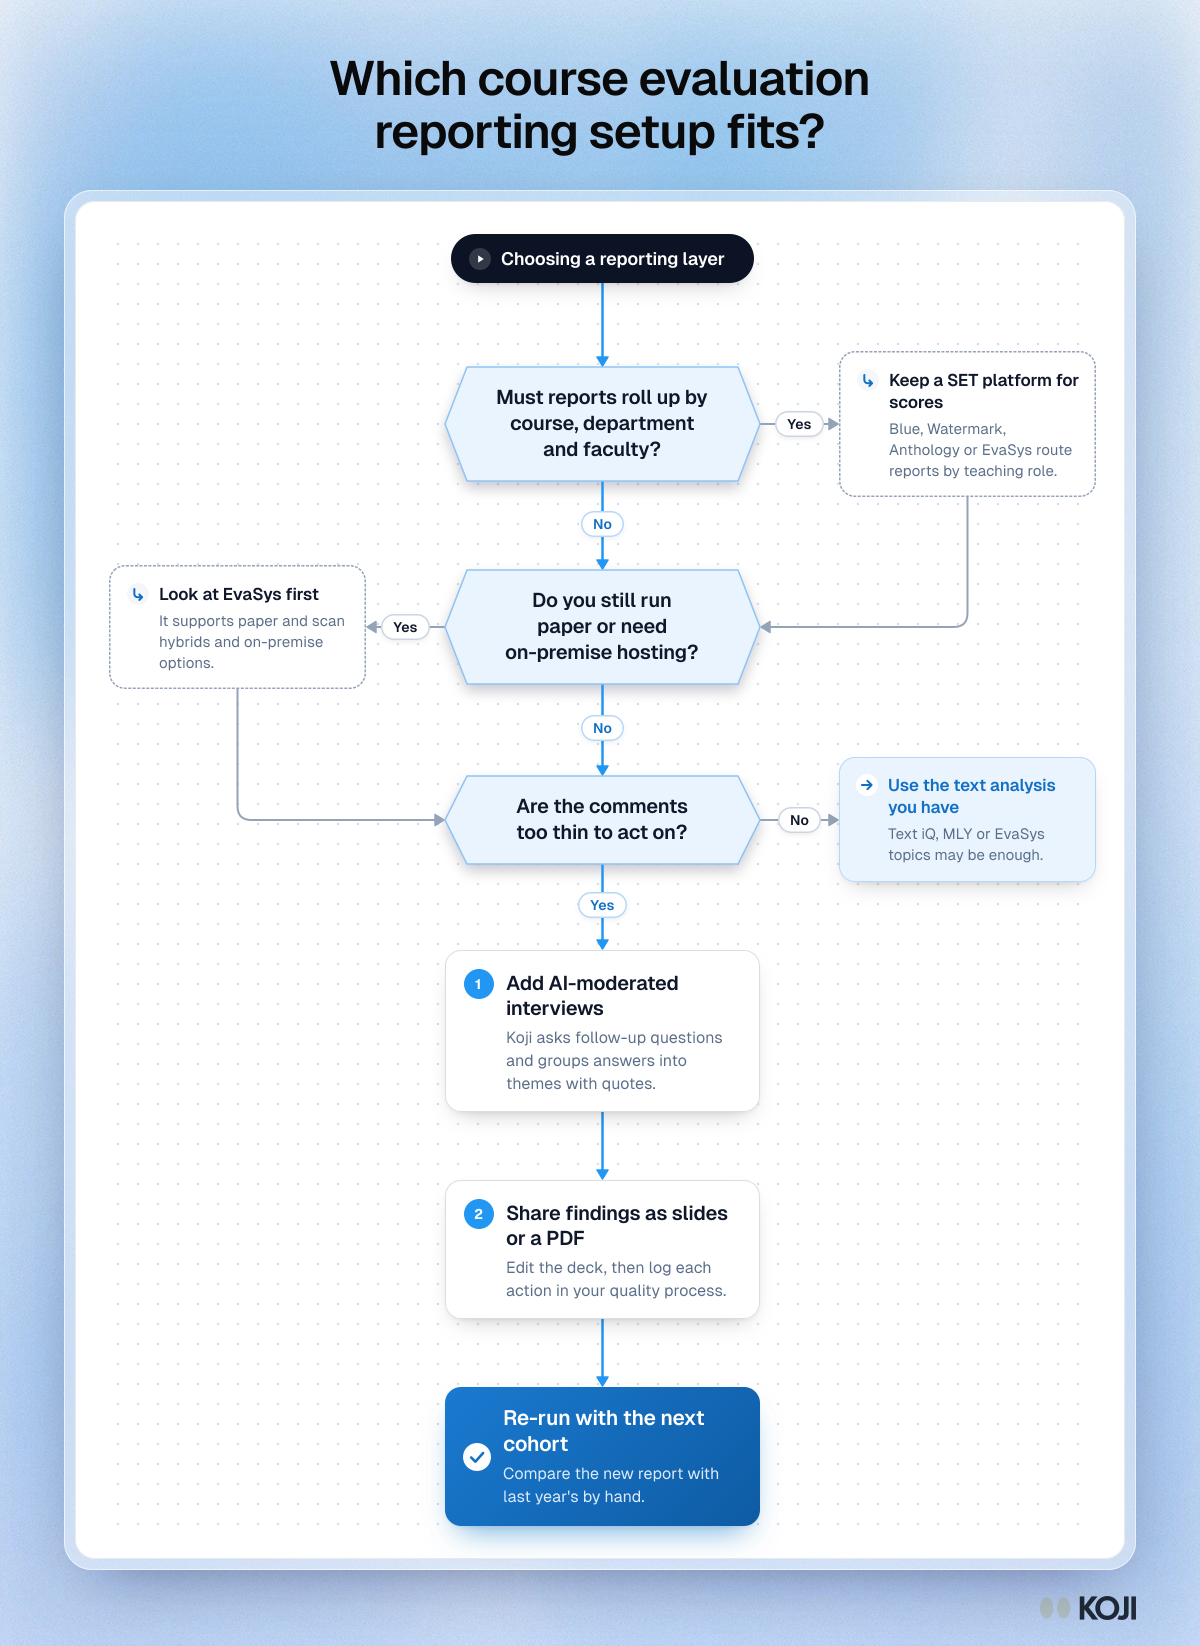
A decision flowchart for quality and teaching and learning teams choosing how to report course evaluation results. It asks whether reports must roll up through the course hierarchy, whether paper or on-premise hosting is required, and whether open comments are detailed enough to act on. It then points to a score platform, EvaSys, the text analysis you already have, or AI-moderated interviews. Koji covers the interview step, with themed reports that download as editable slides or a PDF.
What's in this flowchart
Start: Choosing a reporting layer
- Must reports roll up by course, department and faculty?
- No: go to 2.
- Yes: Keep a SET platform for scores. Blue, Watermark, Anthology or EvaSys route reports by teaching role. Then go to 2.
- Do you still run paper or need on-premise hosting?
- No: go to 3.
- Yes: Look at EvaSys first. It supports paper and scan hybrids and on-premise options. Then go to 3.
- Are the comments too thin to act on?
- Yes: go to 4.
- No: Use the text analysis you have. Text iQ, MLY or EvaSys topics may be enough.
- Add AI-moderated interviews. Koji asks follow-up questions and groups answers into themes with quotes.
- Share findings as slides or a PDF. Edit the deck, then log each action in your quality process.
- Finish: Re-run with the next cohort. Compare the new report with last year's by hand.
Use this image
Free to use in your docs, decks and posts under CC BY 4.0, as long as you credit Koji with a link to this page. To embed it, paste this into your page:
<a href="https://www.koji.so/visuals/course-evaluation-reporting-tool-decision-flowchart"><img src="https://www.koji.so/visuals/course-evaluation-reporting-tool-decision-flowchart/course-evaluation-reporting-tool-decision-flowchart.png" alt="Flowchart for choosing a course evaluation reporting setup: three questions, two side steps, ending in a re-run with the next cohort." width="1200" height="1646" /></a>
<p>Source: <a href="https://www.koji.so/visuals/course-evaluation-reporting-tool-decision-flowchart">Which course evaluation reporting setup fits?</a>, Koji</p>