Bar chart
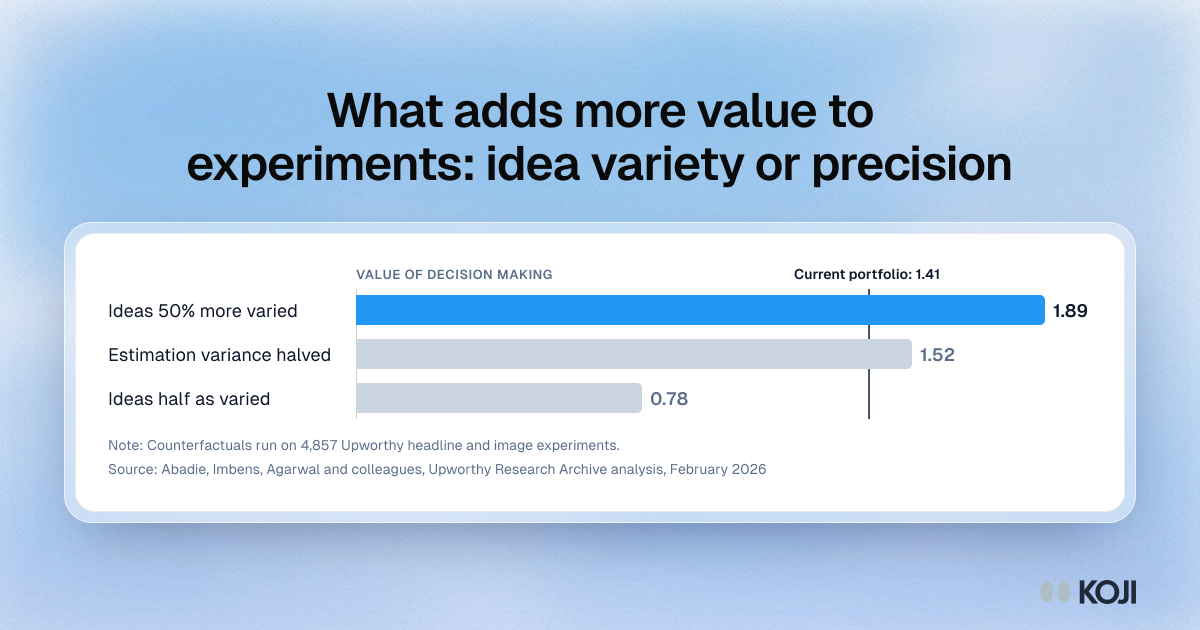
What adds more value to experiments: idea variety or precision
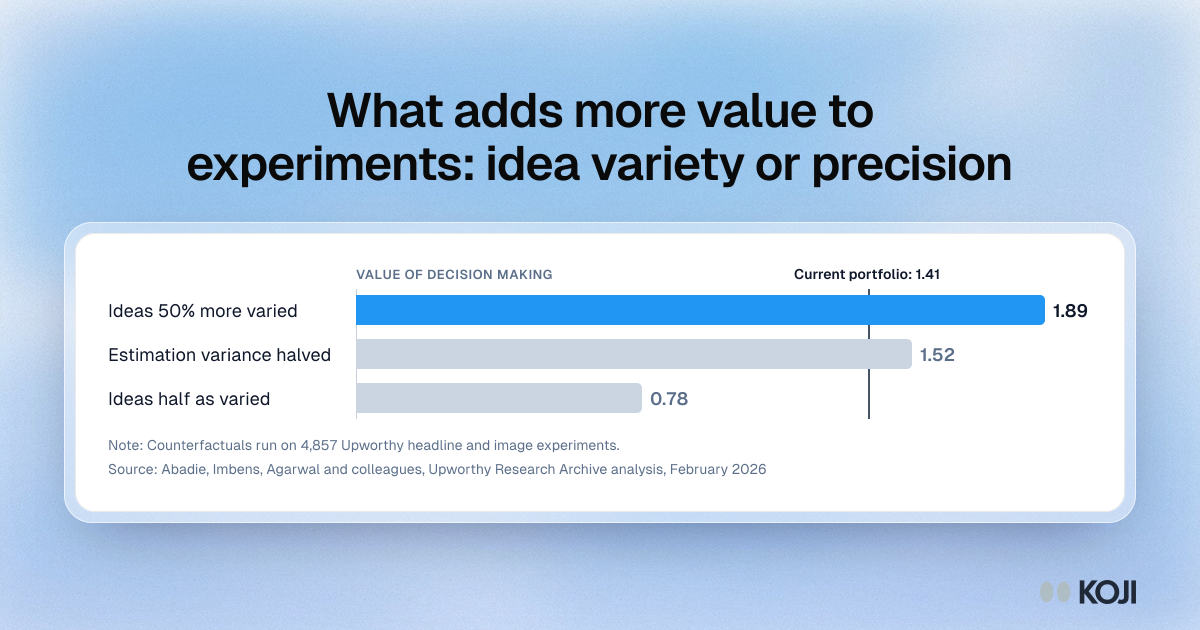
A bar chart of three counterfactuals from Alberto Abadie, Guido Imbens, Anish Agarwal and colleagues, who measured the value of evidence-based decision making across 4,857 online experiments in the Upworthy Research Archive. Halving estimation variance raised that value from 1.4057 to 1.5228, while making true effects 50% more varied raised it to 1.8882. For product teams, the spread of ideas you test matters more than the size of each sample.
Where this appears
What's in this bar chart
| Value of decision making | |
|---|---|
| Ideas 50% more varied | 1.89 |
| Estimation variance halved | 1.52 |
| Ideas half as varied | 0.78 |
Reference line: Current portfolio, 1.41.
Counterfactuals run on 4,857 Upworthy headline and image experiments.
Use this image
Free to use in your docs, decks and posts under CC BY 4.0, as long as you credit Koji with a link to this page. To embed it, paste this into your page:
html
<a href="https://www.koji.so/visuals/experiment-value-idea-variety-vs-sample-precision"><img src="https://www.koji.so/visuals/experiment-value-idea-variety-vs-sample-precision/experiment-value-idea-variety-vs-sample-precision.png" alt="Bar chart from 4,857 Upworthy experiments: 50% more varied ideas raise decision value by 34%, halving variance adds 8%, halving variety cuts it by 44%." width="1200" height="630" /></a>
<p>Source: <a href="https://www.koji.so/visuals/experiment-value-idea-variety-vs-sample-precision">What adds more value to experiments: idea variety or precision</a>, Koji</p>