Reference table
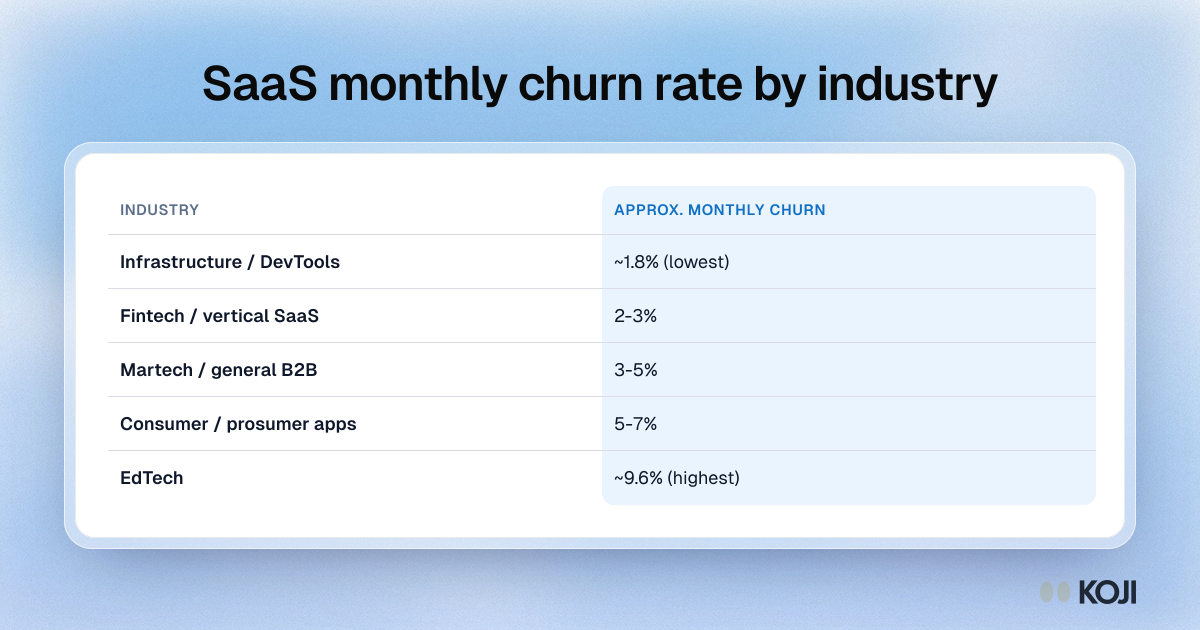
SaaS monthly churn rate by industry
Approximate monthly churn, from infrastructure tools to EdTech
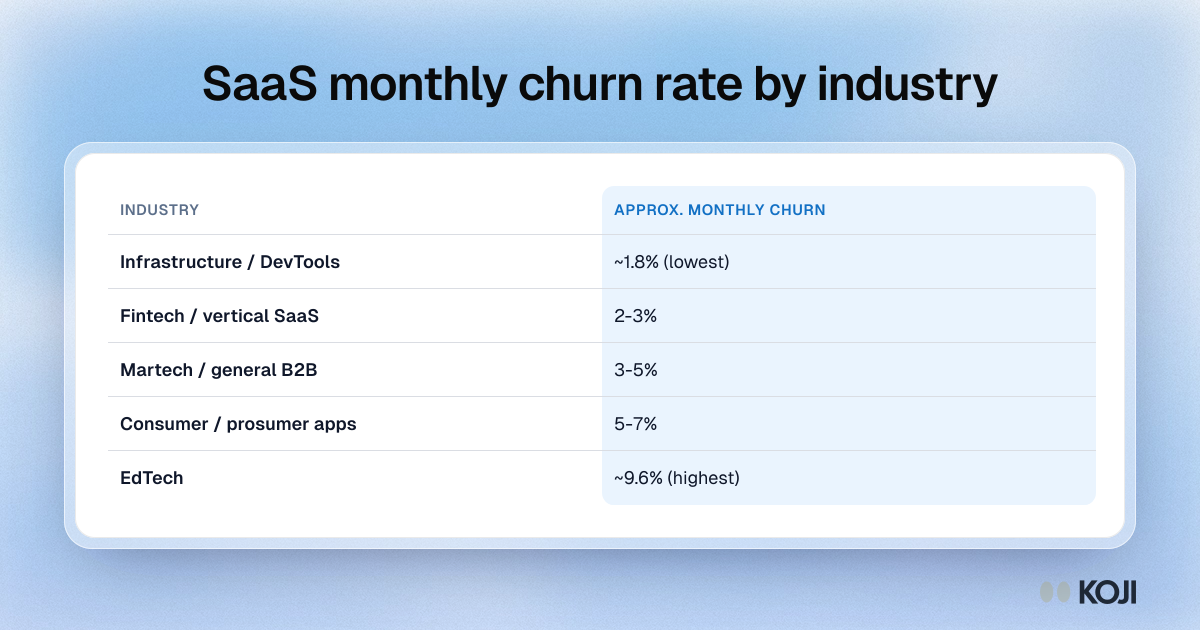
Approximate monthly churn rates for five SaaS categories. Infrastructure and DevTools churn lowest at about 1.8%, fintech and vertical SaaS run 2 to 3%, martech and general B2B 3 to 5%, consumer and prosumer apps 5 to 7%, and EdTech highest at about 9.6%. Use it to sanity-check your own churn against a comparable market. Rates are approximate and quoted monthly, not annually.
Where this appears
What's in this reference table
| Industry | Approx. monthly churn |
|---|---|
| Infrastructure / DevTools | ~1.8% (lowest) |
| Fintech / vertical SaaS | 2-3% |
| Martech / general B2B | 3-5% |
| Consumer / prosumer apps | 5-7% |
| EdTech | ~9.6% (highest) |
Use this image
Free to use in your docs, decks and posts under CC BY 4.0, as long as you credit Koji with a link to this page. To embed it, paste this into your page:
html
<a href="https://www.koji.so/visuals/saas-monthly-churn-rate-by-industry"><img src="https://www.koji.so/visuals/saas-monthly-churn-rate-by-industry/saas-monthly-churn-rate-by-industry.png" alt="Table of approximate SaaS monthly churn by industry, from about 1.8% for infrastructure and DevTools to about 9.6% for EdTech." width="1200" height="630" /></a>
<p>Source: <a href="https://www.koji.so/visuals/saas-monthly-churn-rate-by-industry">SaaS monthly churn rate by industry</a>, Koji</p>