Framework
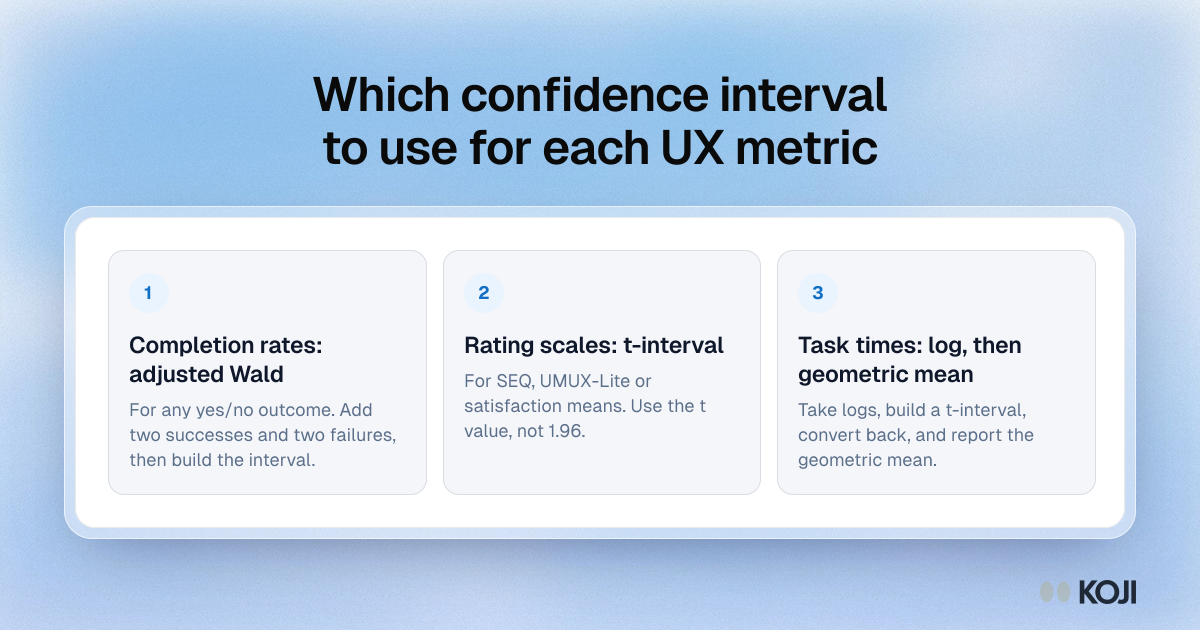
Which confidence interval to use for each UX metric
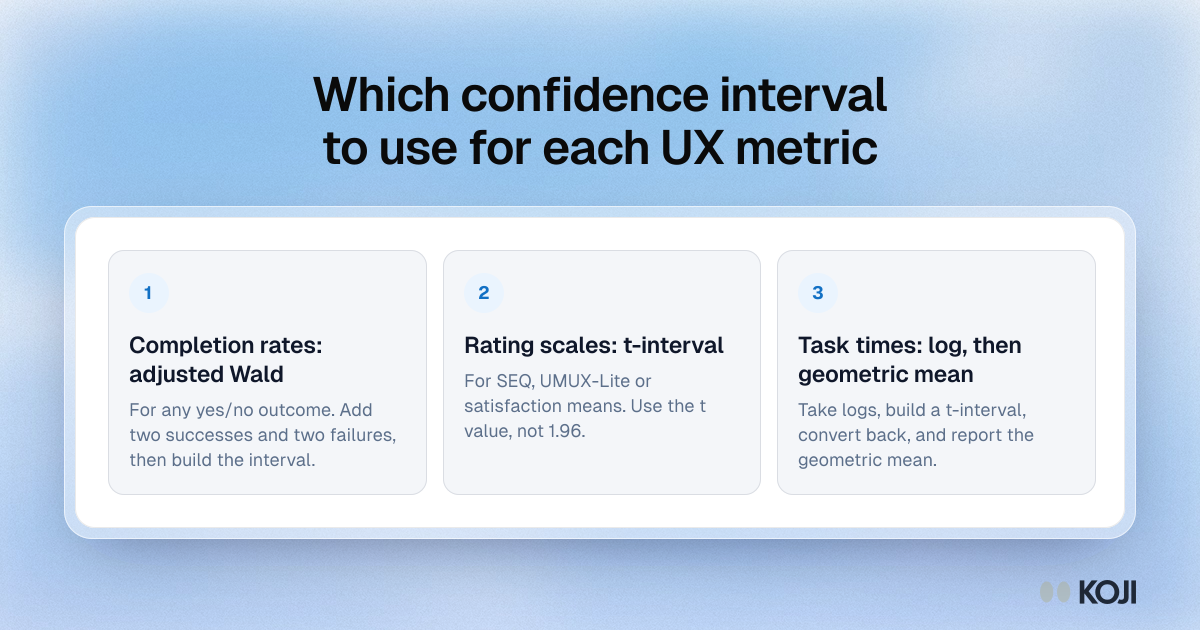
A quick guide to choosing a confidence interval for small-sample UX research. Completion rates and other yes/no outcomes use the adjusted Wald interval, rating scales such as SEQ or UMUX-Lite use a t-interval around the mean, and task times are log-transformed and reported as a geometric mean. The methods follow Jeff Sauro and James R. Lewis's research on samples of 5 to 20 users. Koji's structured questions and CSV export give you the numbers to plug in.
Where this appears
What's in this framework
- Completion rates: adjusted Wald: For any yes/no outcome. Add two successes and two failures, then build the interval.
- Rating scales: t-interval: For SEQ, UMUX-Lite or satisfaction means. Use the t value, not 1.96.
- Task times: log, then geometric mean: Take logs, build a t-interval, convert back, and report the geometric mean.
Use this image
Free to use in your docs, decks and posts under CC BY 4.0, as long as you credit Koji with a link to this page. To embed it, paste this into your page:
html
<a href="https://www.koji.so/visuals/which-confidence-interval-for-ux-metrics"><img src="https://www.koji.so/visuals/which-confidence-interval-for-ux-metrics/which-confidence-interval-for-ux-metrics.png" alt="Framework matching UX metrics to interval methods: adjusted Wald for completion rates, t-intervals for ratings and log-based geometric means for task times." width="1200" height="630" /></a>
<p>Source: <a href="https://www.koji.so/visuals/which-confidence-interval-for-ux-metrics">Which confidence interval to use for each UX metric</a>, Koji</p>