Bar chart
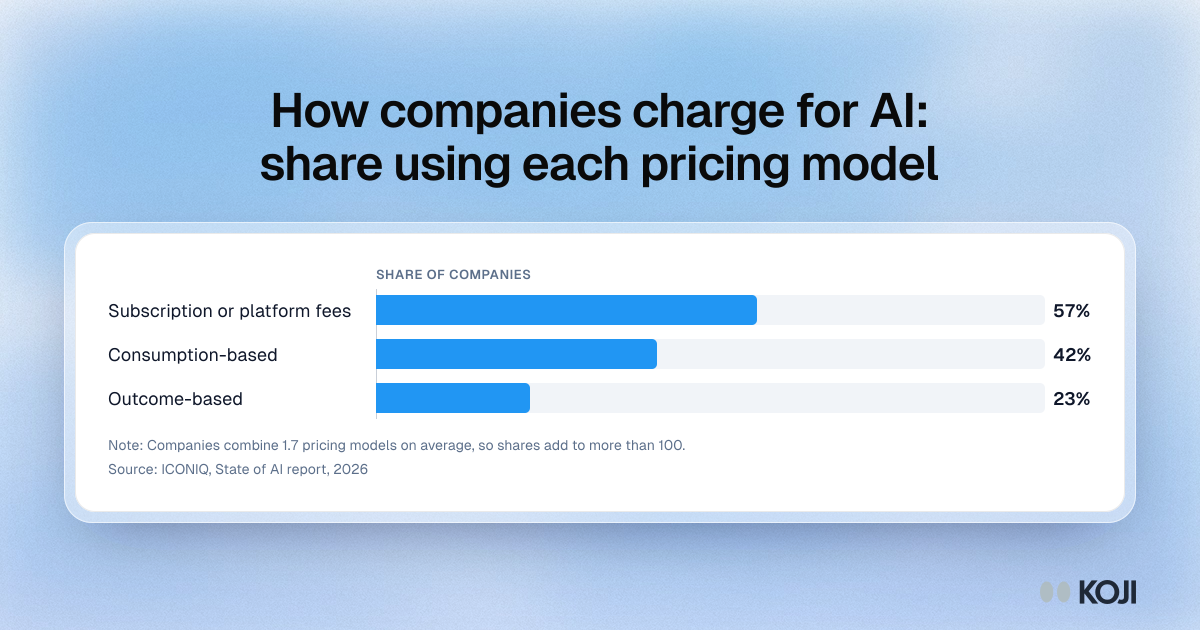
How companies charge for AI: share using each pricing model
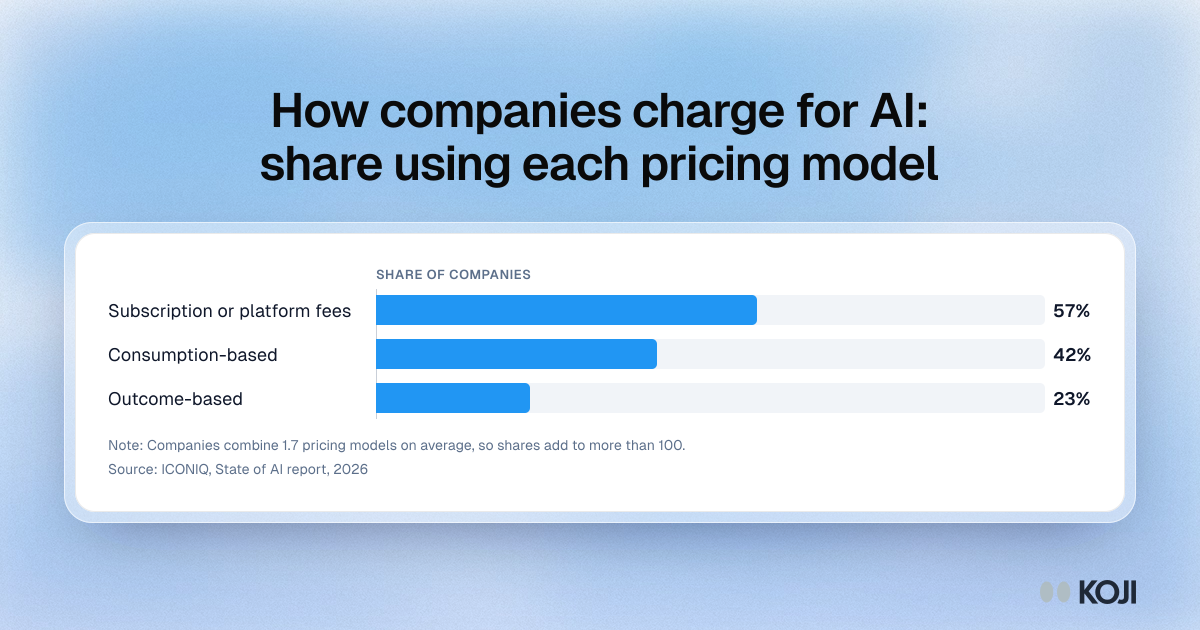
A bar chart of how companies charge for AI, from ICONIQ's 2026 State of AI report. 57% use subscription or platform fees, 42% consumption-based pricing and 23% outcome-based pricing. The average company combines 1.7 models, so the shares add to more than 100. Product managers can use it to decide which billing units to test with buyers before pricing an AI feature.
Where this appears
What's in this bar chart
| Share of companies | |
|---|---|
| Subscription or platform fees | 57% |
| Consumption-based | 42% |
| Outcome-based | 23% |
Companies combine 1.7 pricing models on average, so shares add to more than 100.
Use this image
Free to use in your docs, decks and posts under CC BY 4.0, as long as you credit Koji with a link to this page. To embed it, paste this into your page:
html
<a href="https://www.koji.so/visuals/ai-pricing-models-share-of-companies-2026"><img src="https://www.koji.so/visuals/ai-pricing-models-share-of-companies-2026/ai-pricing-models-share-of-companies-2026.png" alt="Bar chart of AI pricing models in 2026: 57% of companies use subscription or platform fees, 42% consumption-based and 23% outcome-based pricing." width="1200" height="630" /></a>
<p>Source: <a href="https://www.koji.so/visuals/ai-pricing-models-share-of-companies-2026">How companies charge for AI: share using each pricing model</a>, Koji</p>