Reference table
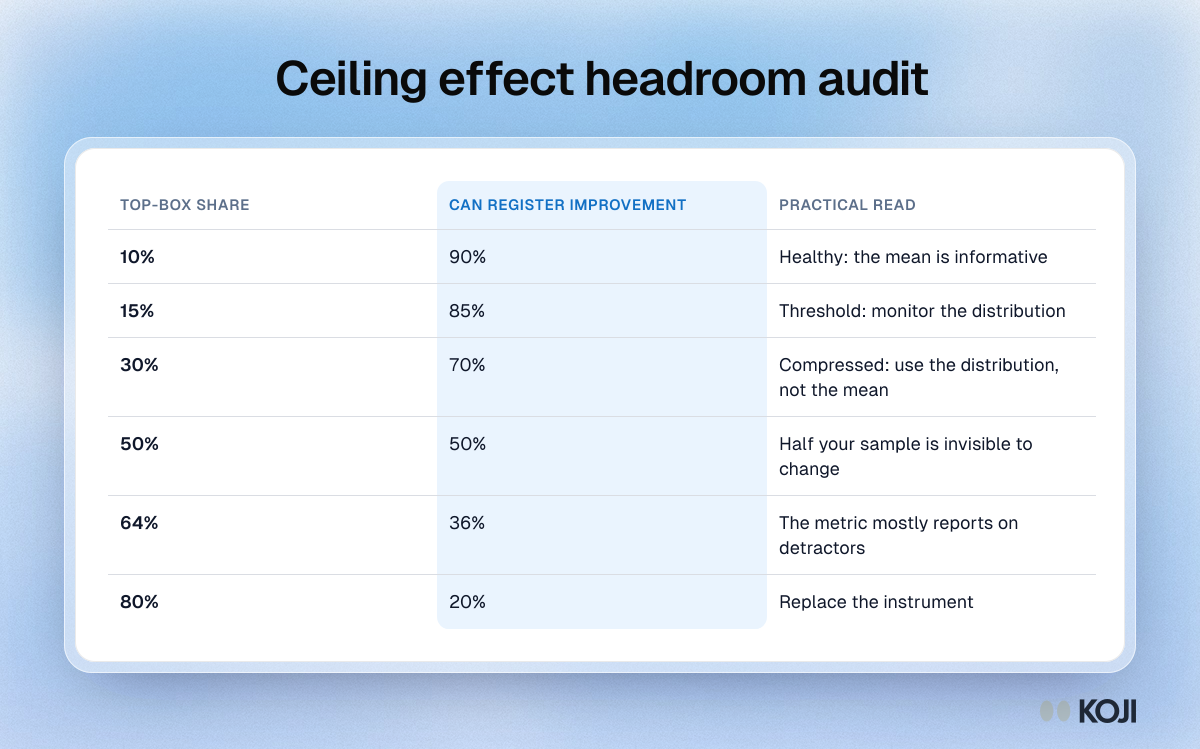
Ceiling effect headroom audit
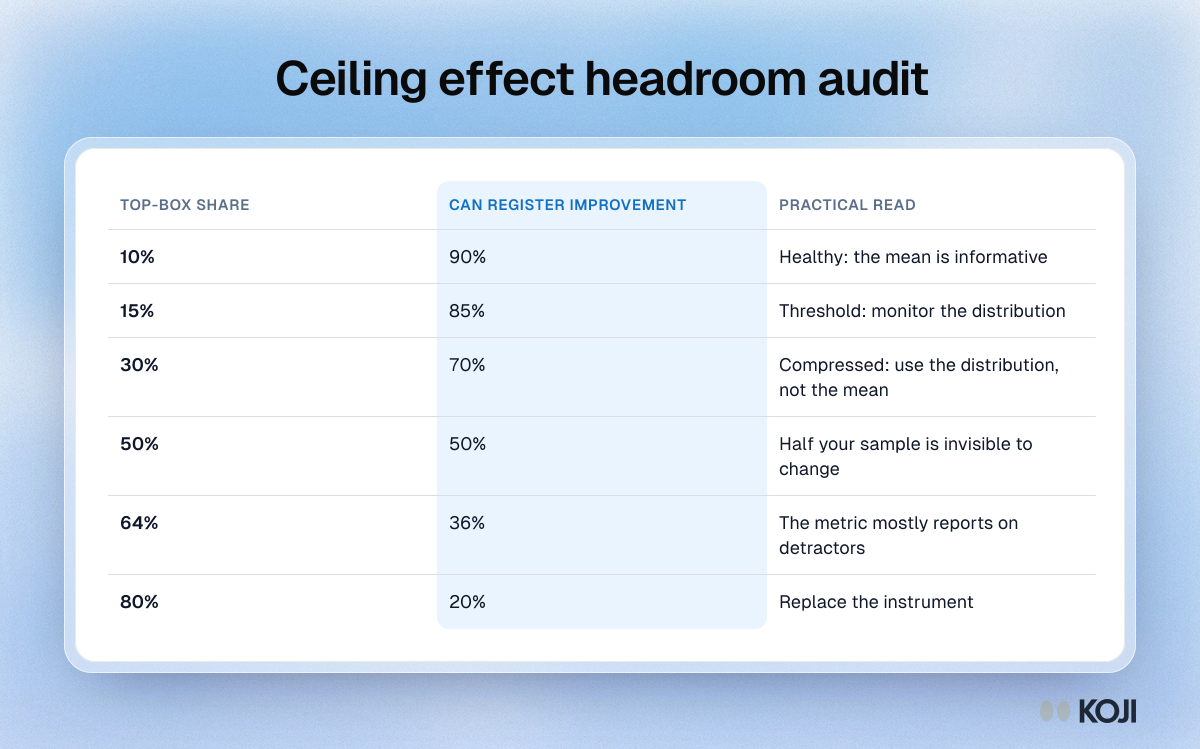
A quick headroom audit for any satisfaction or rating scale. The higher the share of respondents at the maximum score, the smaller the share who can show any improvement, from 90% at a 10% top-box share to 20% at 80%. Run it overall and by segment before reading a mean. The 15% threshold follows Terwee and colleagues (2007).
Where this appears
What's in this reference table
| Top-box share | Can register improvement | Practical read |
|---|---|---|
| 10% | 90% | Healthy: the mean is informative |
| 15% | 85% | Threshold: monitor the distribution |
| 30% | 70% | Compressed: use the distribution, not the mean |
| 50% | 50% | Half your sample is invisible to change |
| 64% | 36% | The metric mostly reports on detractors |
| 80% | 20% | Replace the instrument |
Use this image
Free to use in your docs, decks and posts under CC BY 4.0, as long as you credit Koji with a link to this page. To embed it, paste this into your page:
html
<a href="https://www.koji.so/visuals/ceiling-effect-headroom-audit-table"><img src="https://www.koji.so/visuals/ceiling-effect-headroom-audit-table/ceiling-effect-headroom-audit-table.png" alt="Table of top-box shares from 10% to 80% against the share of respondents who can still register improvement, with what each means." width="1200" height="749" /></a>
<p>Source: <a href="https://www.koji.so/visuals/ceiling-effect-headroom-audit-table">Ceiling effect headroom audit</a>, Koji</p>