Reference table
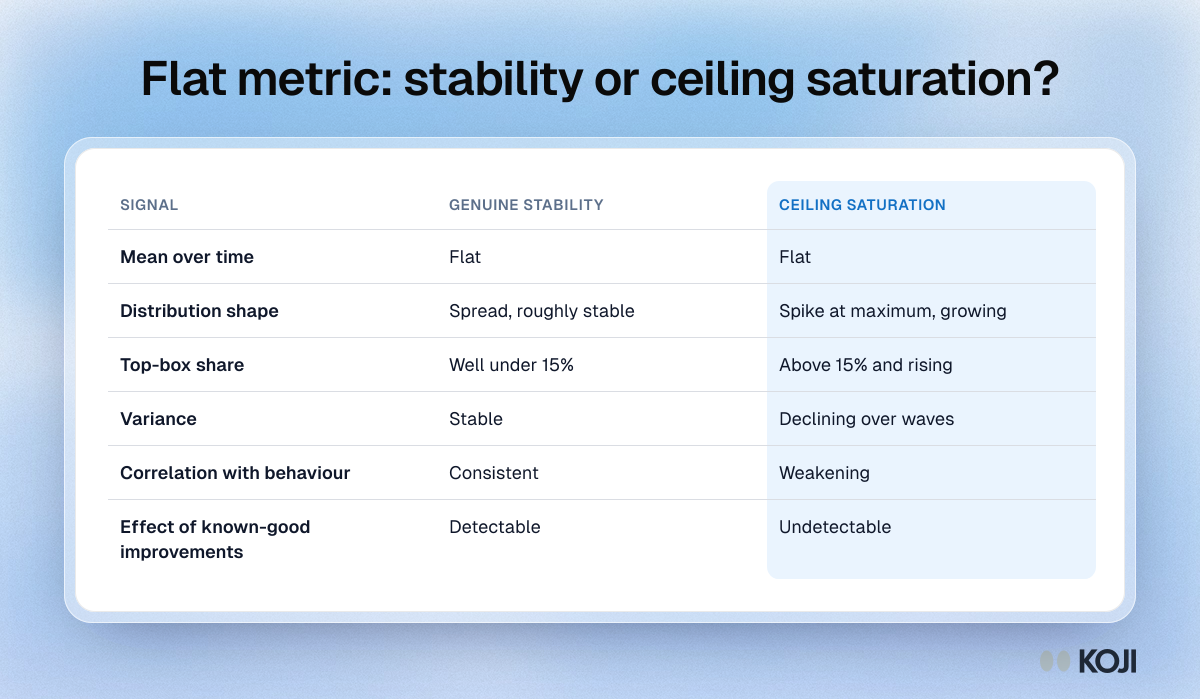
Flat metric: stability or ceiling saturation?
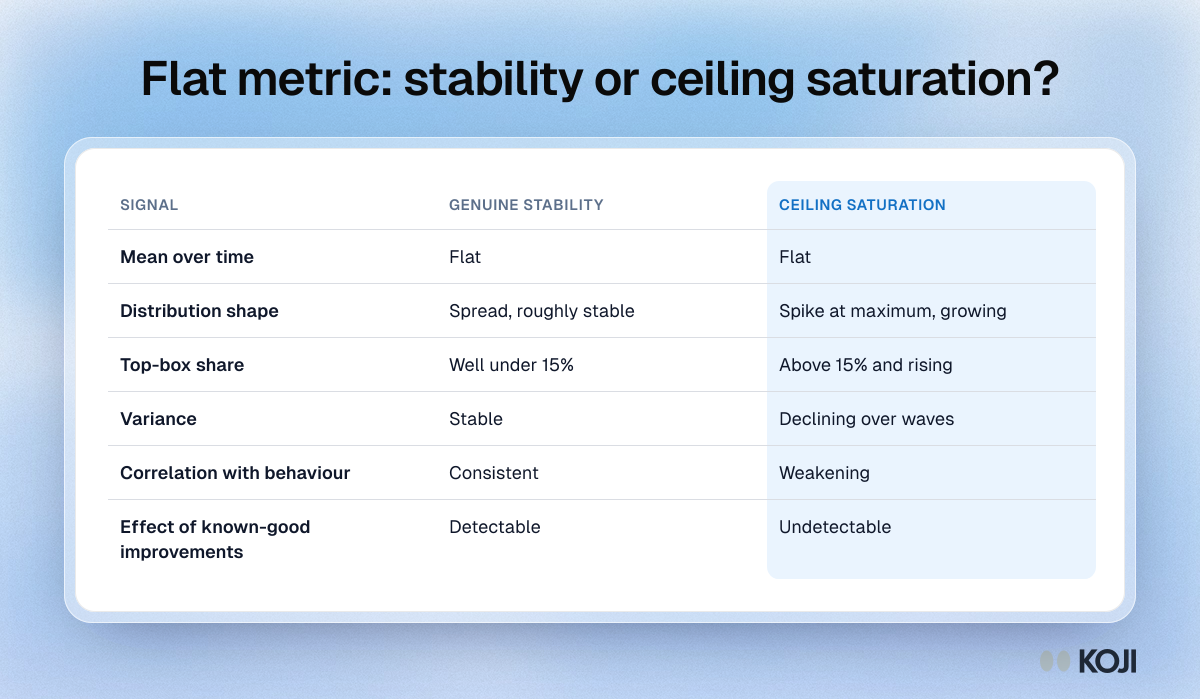
Six signals that tell genuine stability apart from ceiling saturation when a satisfaction or rating metric stays flat for quarters. Look at the distribution, the top-box share, variance across waves, the link to behaviour and whether known improvements registered. Use it before you call a tracker mature.
Where this appears
What's in this reference table
| Signal | Genuine stability | Ceiling saturation |
|---|---|---|
| Mean over time | Flat | Flat |
| Distribution shape | Spread, roughly stable | Spike at maximum, growing |
| Top-box share | Well under 15% | Above 15% and rising |
| Variance | Stable | Declining over waves |
| Correlation with behaviour | Consistent | Weakening |
| Effect of known-good improvements | Detectable | Undetectable |
Use this image
Free to use in your docs, decks and posts under CC BY 4.0, as long as you credit Koji with a link to this page. To embed it, paste this into your page:
html
<a href="https://www.koji.so/visuals/stability-vs-ceiling-saturation-table"><img src="https://www.koji.so/visuals/stability-vs-ceiling-saturation-table/stability-vs-ceiling-saturation-table.png" alt="Table comparing six signals of genuine stability against ceiling saturation in a flat survey metric, from distribution shape to variance over waves." width="1200" height="699" /></a>
<p>Source: <a href="https://www.koji.so/visuals/stability-vs-ceiling-saturation-table">Flat metric: stability or ceiling saturation?</a>, Koji</p>