Reference table
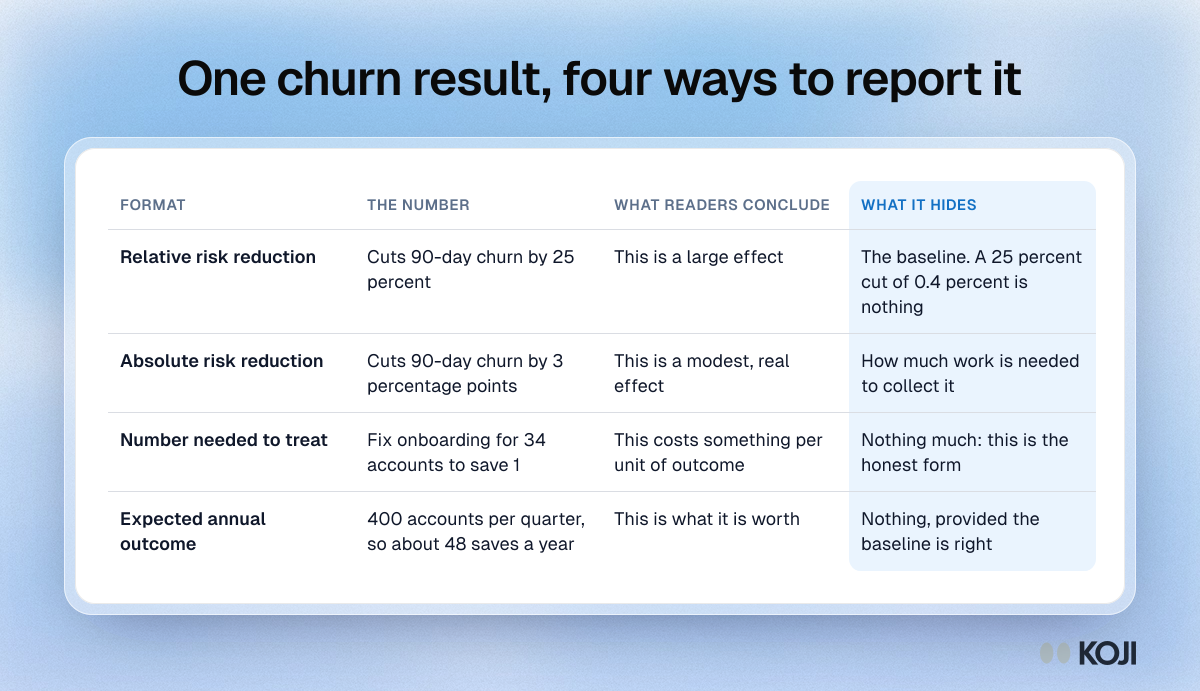
One churn result, four ways to report it
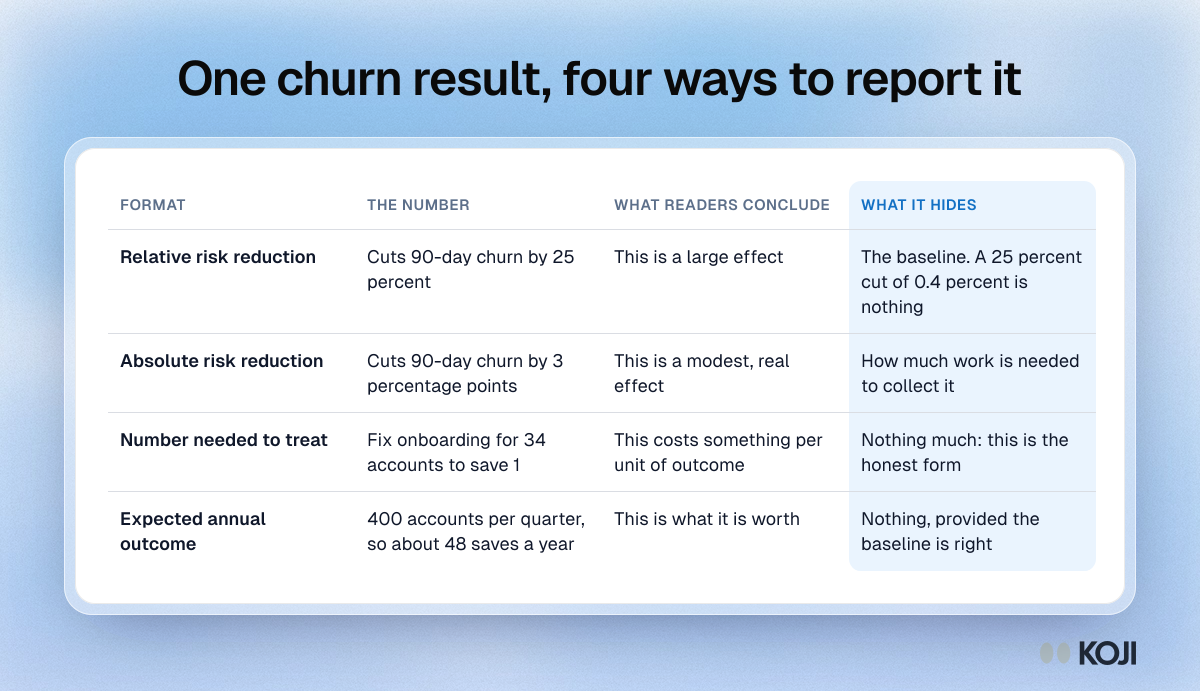
A worked example that reports one onboarding experiment, 90-day churn falling from 12 percent to 9 percent, in four formats: relative risk reduction, absolute risk reduction, number needed to treat and expected annual saves. Each row shows what the format leads a reader to conclude and what it leaves out. Product and research teams can use it to rewrite a percentage lift as a count of accounts that can be costed.
Where this appears
What's in this reference table
| Format | The number | What readers conclude | What it hides |
|---|---|---|---|
| Relative risk reduction | Cuts 90-day churn by 25 percent | This is a large effect | The baseline. A 25 percent cut of 0.4 percent is nothing |
| Absolute risk reduction | Cuts 90-day churn by 3 percentage points | This is a modest, real effect | How much work is needed to collect it |
| Number needed to treat | Fix onboarding for 34 accounts to save 1 | This costs something per unit of outcome | Nothing much: this is the honest form |
| Expected annual outcome | 400 accounts per quarter, so about 48 saves a year | This is what it is worth | Nothing, provided the baseline is right |
Use this image
Free to use in your docs, decks and posts under CC BY 4.0, as long as you credit Koji with a link to this page. To embed it, paste this into your page:
html
<a href="https://www.koji.so/visuals/churn-effect-four-formats-relative-absolute-nnt"><img src="https://www.koji.so/visuals/churn-effect-four-formats-relative-absolute-nnt/churn-effect-four-formats-relative-absolute-nnt.png" alt="Table showing one onboarding result, churn down from 12% to 9%, as a relative reduction, an absolute reduction, a number needed to treat and an annual count." width="1200" height="691" /></a>
<p>Source: <a href="https://www.koji.so/visuals/churn-effect-four-formats-relative-absolute-nnt">One churn result, four ways to report it</a>, Koji</p>