Column chart
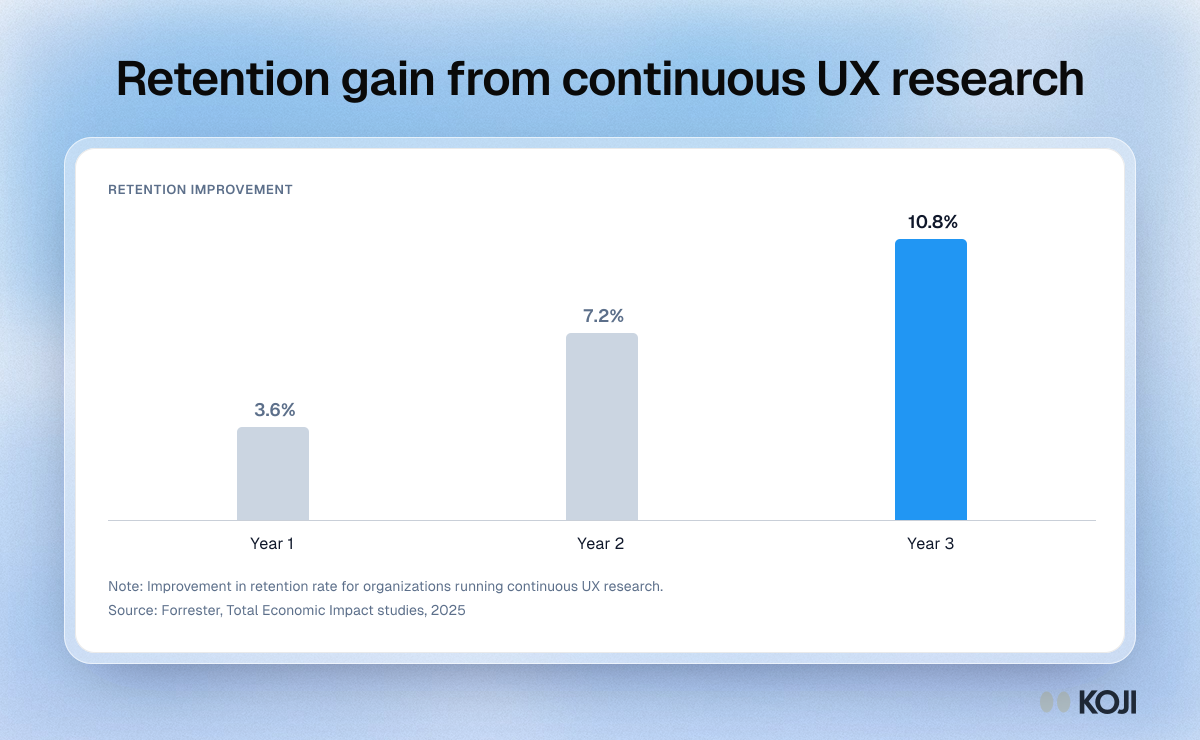
Retention gain from continuous UX research
How retention improves over three years of continuous research
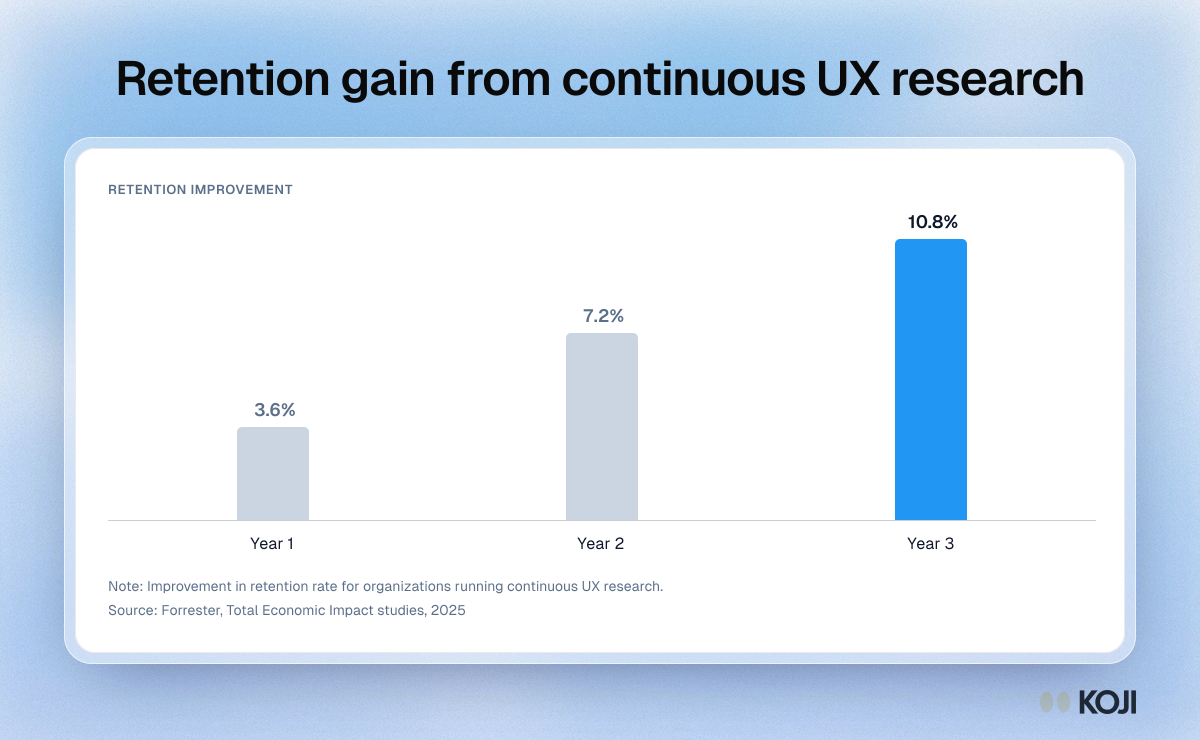
A column chart of the retention improvement organizations see when they run continuous UX research: 3.6% in the first year, 7.2% in the second and 10.8% in the third. The figures come from Forrester Total Economic Impact studies, as cited in Koji's 2026 UX research statistics roundup. Use it to make the case for ongoing research over one-off studies.
Where this appears
What's in this column chart
| Retention improvement | |
|---|---|
| Year 1 | 3.6% |
| Year 2 | 7.2% |
| Year 3 | 10.8% |
Improvement in retention rate for organizations running continuous UX research.
Use this image
Free to use in your docs, decks and posts under CC BY 4.0, as long as you credit Koji with a link to this page. To embed it, paste this into your page:
html
<a href="https://www.koji.so/visuals/continuous-ux-research-retention-gain-by-year"><img src="https://www.koji.so/visuals/continuous-ux-research-retention-gain-by-year/continuous-ux-research-retention-gain-by-year.png" alt="Column chart of retention improvement from continuous UX research: 3.6% in year one, 7.2% in year two and 10.8% in year three." width="1200" height="740" /></a>
<p>Source: <a href="https://www.koji.so/visuals/continuous-ux-research-retention-gain-by-year">Retention gain from continuous UX research</a>, Koji</p>