Bar chart
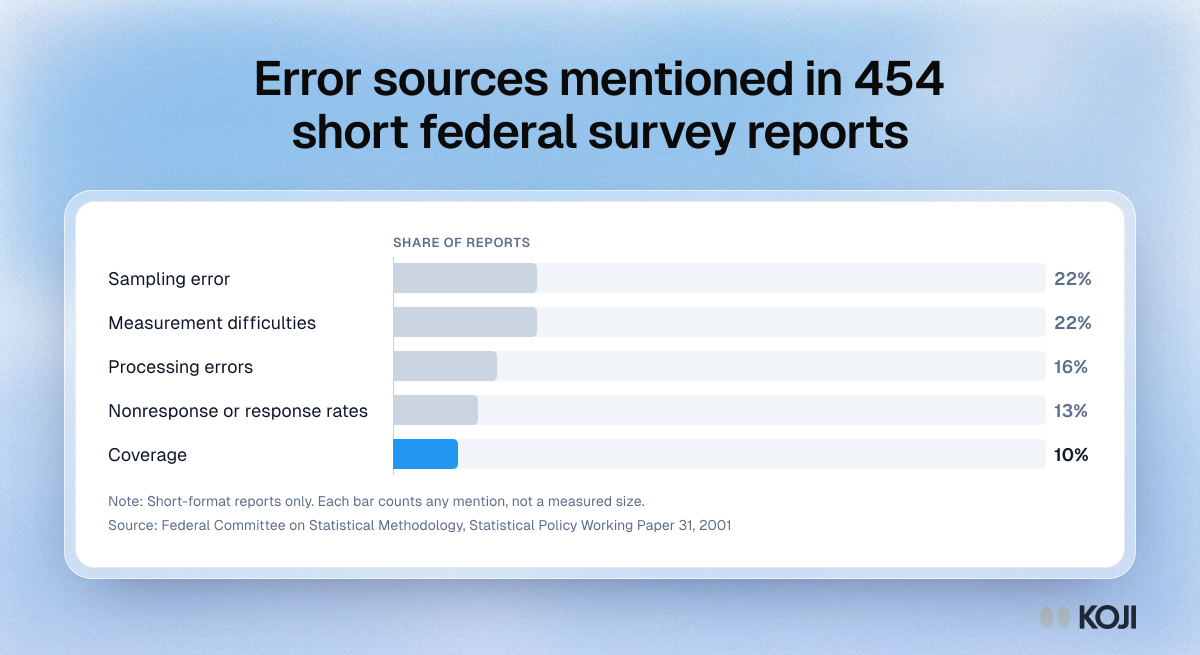
Error sources mentioned in 454 short federal survey reports
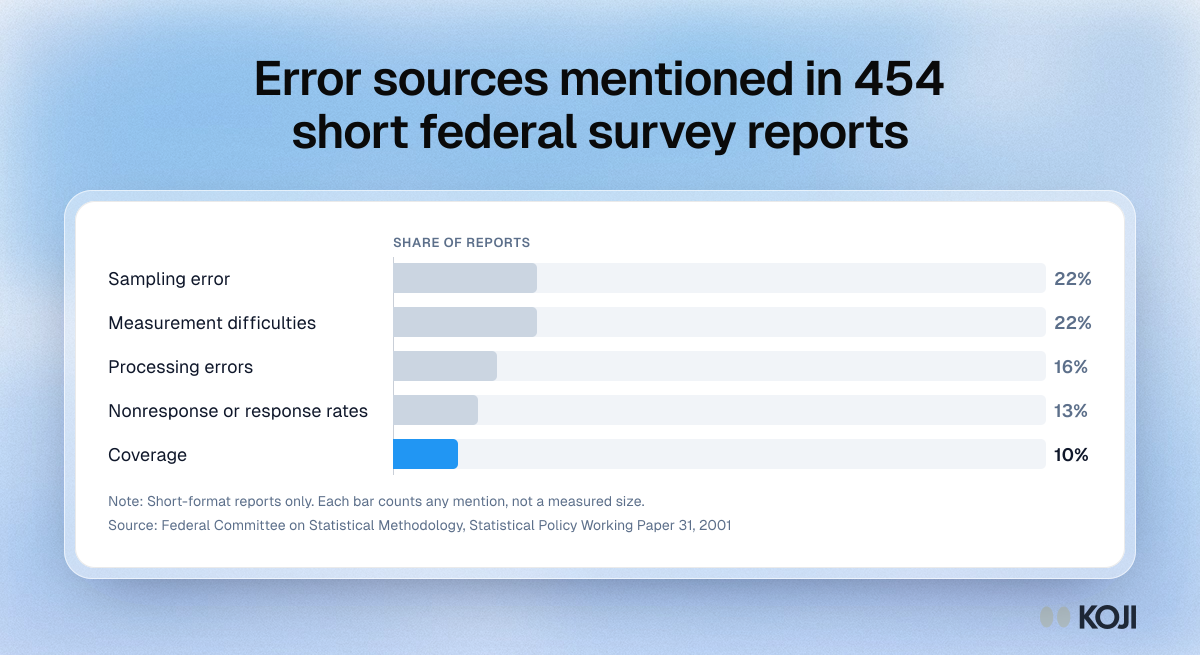
A bar chart from the US Federal Committee on Statistical Methodology audit of 454 short-format federal survey reports, showing how many mentioned each source of survey error. Sampling error and measurement difficulties were each mentioned in 22% of reports, processing errors in 16%, nonresponse or response rates in 13% and coverage in 10%. It shows how little of total survey error gets reported even by agencies with methodology staff.
Where this appears
What's in this bar chart
| Share of reports | |
|---|---|
| Sampling error | 22% |
| Measurement difficulties | 22% |
| Processing errors | 16% |
| Nonresponse or response rates | 13% |
| Coverage | 10% |
Short-format reports only. Each bar counts any mention, not a measured size.
Use this image
Free to use in your docs, decks and posts under CC BY 4.0, as long as you credit Koji with a link to this page. To embed it, paste this into your page:
html
<a href="https://www.koji.so/visuals/federal-survey-reports-error-sources-mentioned"><img src="https://www.koji.so/visuals/federal-survey-reports-error-sources-mentioned/federal-survey-reports-error-sources-mentioned.png" alt="Bar chart of 454 short federal survey reports by error source mentioned: sampling 22%, measurement 22%, processing 16%, nonresponse 13%, coverage 10%." width="1200" height="655" /></a>
<p>Source: <a href="https://www.koji.so/visuals/federal-survey-reports-error-sources-mentioned">Error sources mentioned in 454 short federal survey reports</a>, Koji</p>