Bar chart
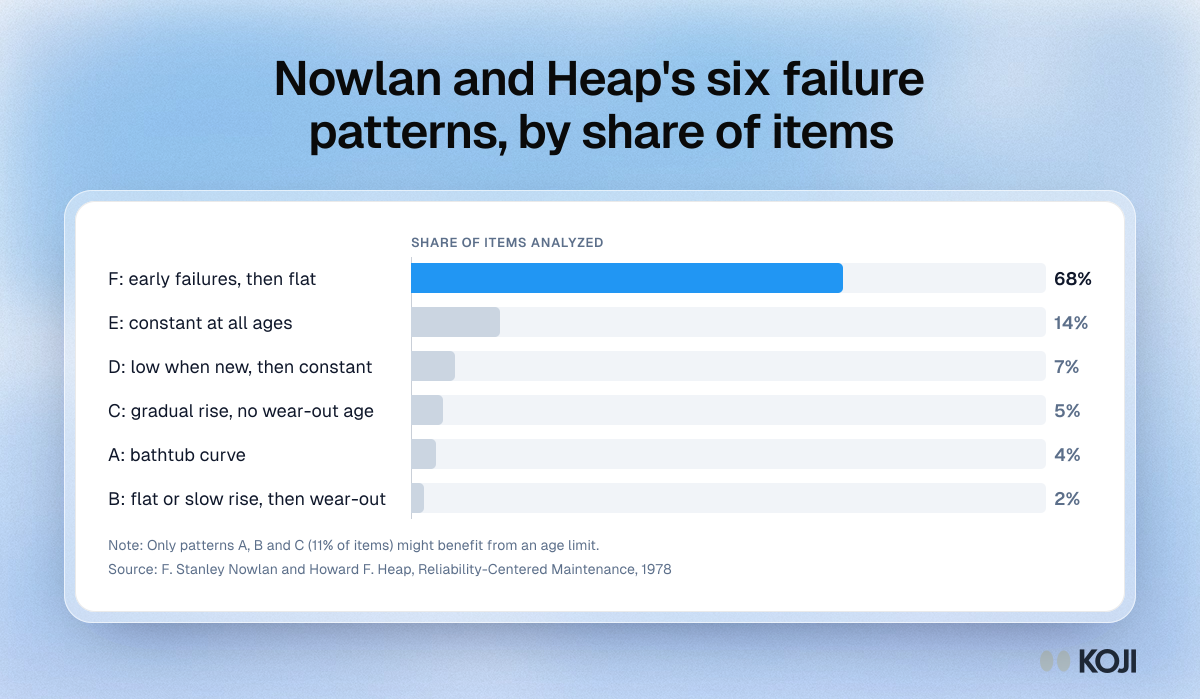
Nowlan and Heap's six failure patterns, by share of items
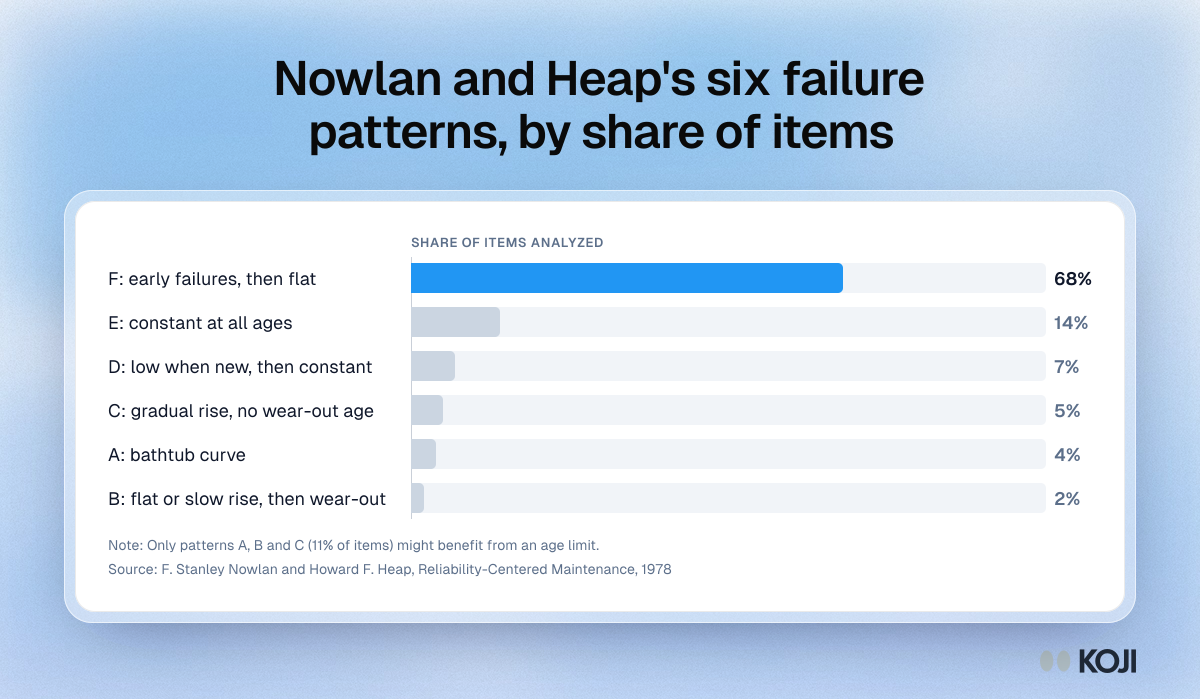
A bar chart of the six age-reliability patterns Nowlan and Heap found when United Airlines plotted conditional failure probability against operating age. Pattern F, early failures followed by a flat tail, covered 68% of items, while the familiar bathtub curve covered just 4%. Only patterns A, B and C, 11% of items, might benefit from an age limit. Product teams use it to read churn hazard curves, since a software account behaves more like a complex item than a part that wears out.
Where this appears
What's in this bar chart
| Share of items | |
|---|---|
| F: early failures, then flat | 68% |
| E: constant at all ages | 14% |
| D: low when new, then constant | 7% |
| C: gradual rise, no wear-out age | 5% |
| A: bathtub curve | 4% |
| B: flat or slow rise, then wear-out | 2% |
Only patterns A, B and C (11% of items) might benefit from an age limit.
Use this image
Free to use in your docs, decks and posts under CC BY 4.0, as long as you credit Koji with a link to this page. To embed it, paste this into your page:
html
<a href="https://www.koji.so/visuals/nowlan-heap-six-failure-patterns-share"><img src="https://www.koji.so/visuals/nowlan-heap-six-failure-patterns-share/nowlan-heap-six-failure-patterns-share.png" alt="Bar chart of United Airlines components by failure pattern: F early failures then flat 68%, E constant 14%, D 7%, C 5%, A bathtub 4%, B 2%." width="1200" height="699" /></a>
<p>Source: <a href="https://www.koji.so/visuals/nowlan-heap-six-failure-patterns-share">Nowlan and Heap's six failure patterns, by share of items</a>, Koji</p>