Reference table
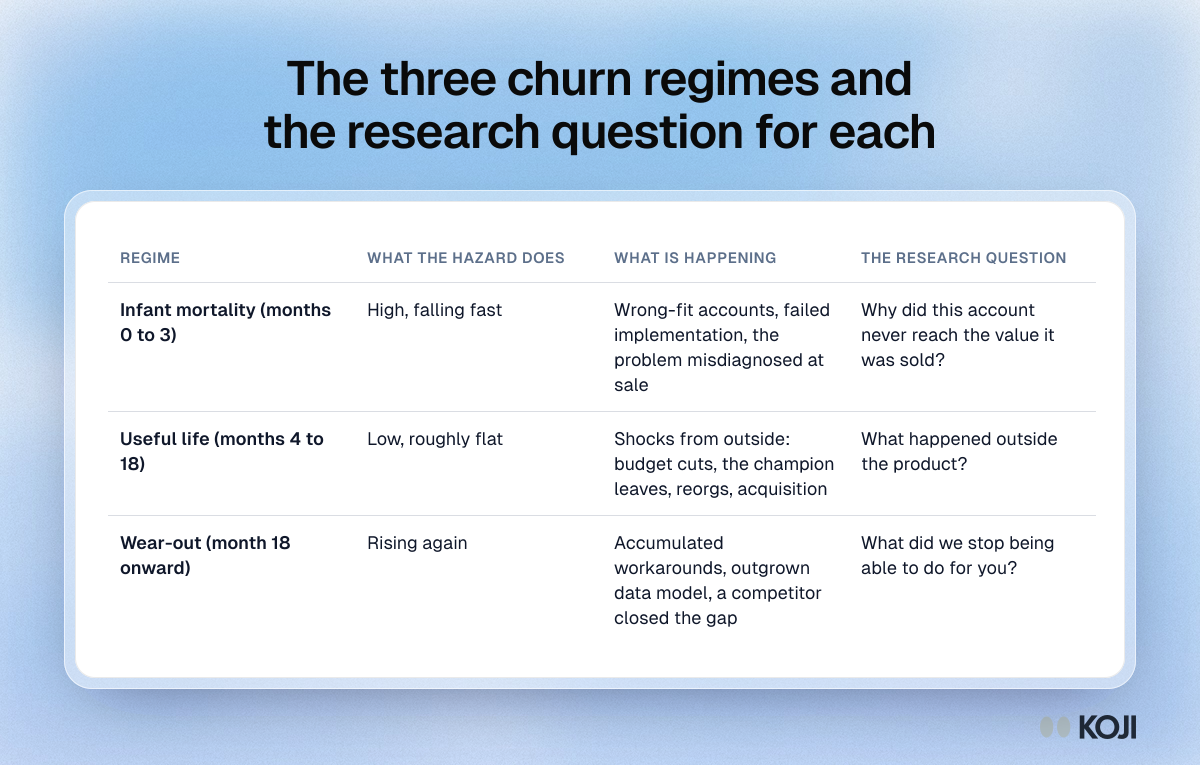
The three churn regimes and the research question for each
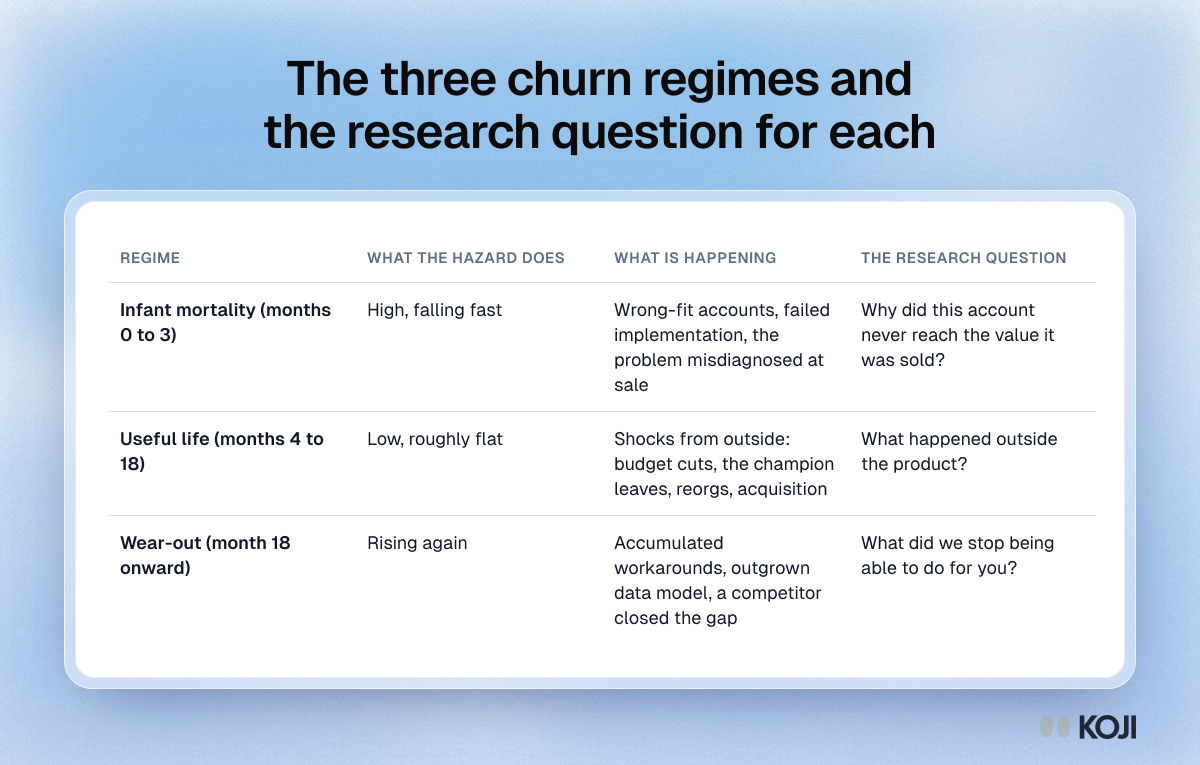
A table that splits churn by tenure into three regimes read from the hazard curve. Infant mortality in the first three months comes from wrong-fit accounts and failed implementations. Useful life, months 4 to 18, is low, flat churn driven by shocks outside the product. Wear-out after month 18 comes from accumulated workarounds and competitors closing the gap. Each row gives the research question to ask, so you can run one churn study per regime instead of one blended survey.
Where this appears
What's in this reference table
| Regime | What the hazard does | What is happening | The research question |
|---|---|---|---|
| Infant mortality (months 0 to 3) | High, falling fast | Wrong-fit accounts, failed implementation, the problem misdiagnosed at sale | Why did this account never reach the value it was sold? |
| Useful life (months 4 to 18) | Low, roughly flat | Shocks from outside: budget cuts, the champion leaves, reorgs, acquisition | What happened outside the product? |
| Wear-out (month 18 onward) | Rising again | Accumulated workarounds, outgrown data model, a competitor closed the gap | What did we stop being able to do for you? |
Use this image
Free to use in your docs, decks and posts under CC BY 4.0, as long as you credit Koji with a link to this page. To embed it, paste this into your page:
html
<a href="https://www.koji.so/visuals/churn-hazard-three-regimes-research-questions"><img src="https://www.koji.so/visuals/churn-hazard-three-regimes-research-questions/churn-hazard-three-regimes-research-questions.png" alt="Table of three churn hazard regimes: infant mortality in months 0 to 3, useful life in months 4 to 18 and wear-out after 18, with causes and research questions." width="1200" height="765" /></a>
<p>Source: <a href="https://www.koji.so/visuals/churn-hazard-three-regimes-research-questions">The three churn regimes and the research question for each</a>, Koji</p>