Bar chart
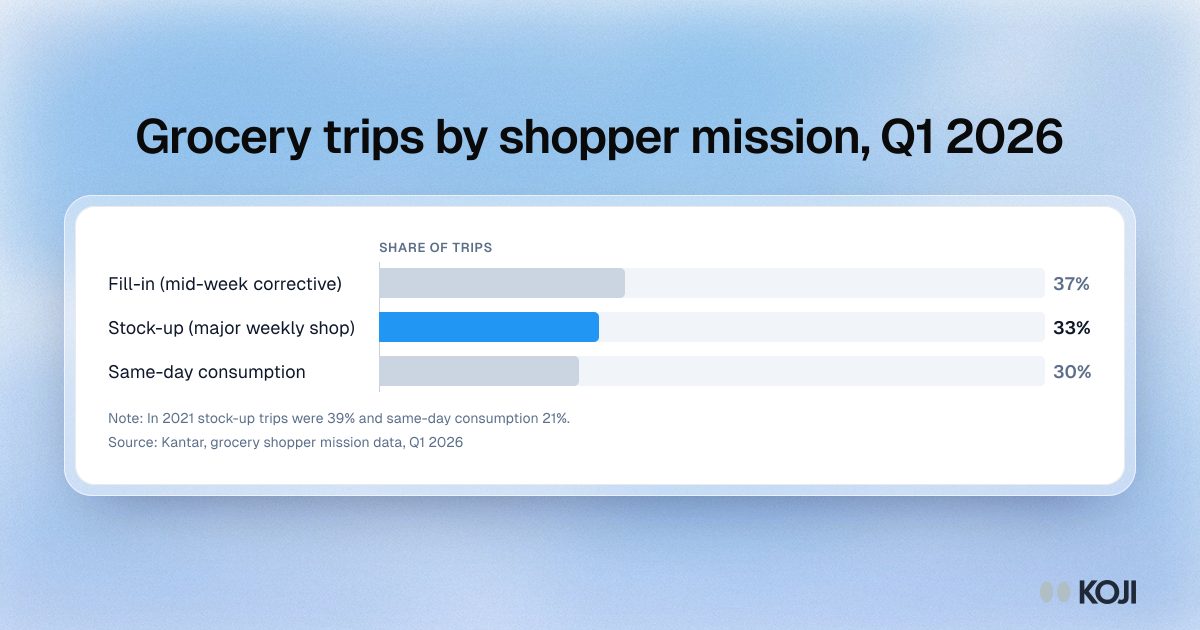
Grocery trips by shopper mission, Q1 2026
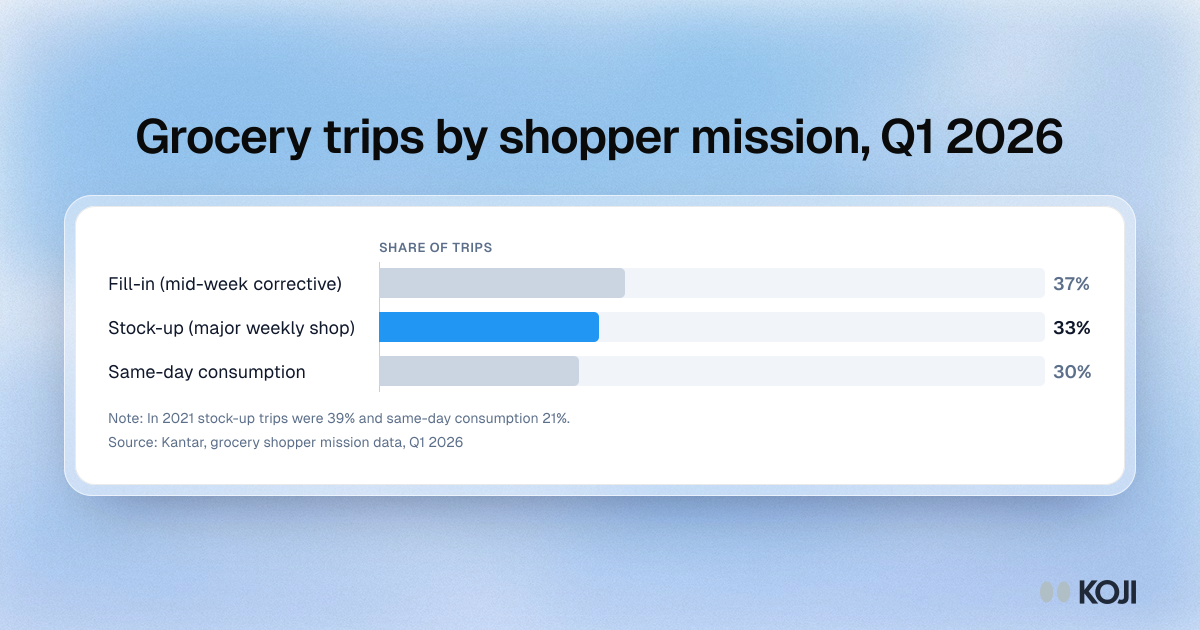
A bar chart of how grocery trips split by shopper mission in the first quarter of 2026, from Kantar data reported in mid-2026: fill-in trips 37%, stock-up trips 33% and same-day consumption trips 30%. In 2021 stock-up trips were 39% and same-day trips 21%. It is for category, shopper and insights teams deciding whether to study trips or people. Koji can run trip reconstruction interviews by voice soon after a shop, while recall is still good.
Where this appears
What's in this bar chart
| Share of trips, Q1 2026 | |
|---|---|
| Fill-in (mid-week corrective) | 37% |
| Stock-up (major weekly shop) | 33% |
| Same-day consumption | 30% |
In 2021 stock-up trips were 39% and same-day consumption 21%.
Use this image
Free to use in your docs, decks and posts under CC BY 4.0, as long as you credit Koji with a link to this page. To embed it, paste this into your page:
html
<a href="https://www.koji.so/visuals/grocery-trips-by-shopper-mission-2026"><img src="https://www.koji.so/visuals/grocery-trips-by-shopper-mission-2026/grocery-trips-by-shopper-mission-2026.png" alt="Bar chart of grocery trips by shopper mission in Q1 2026: fill-in 37%, stock-up 33% and same-day consumption 30%, per Kantar data." width="1200" height="630" /></a>
<p>Source: <a href="https://www.koji.so/visuals/grocery-trips-by-shopper-mission-2026">Grocery trips by shopper mission, Q1 2026</a>, Koji</p>