Flowchart
How to report Likert scale results
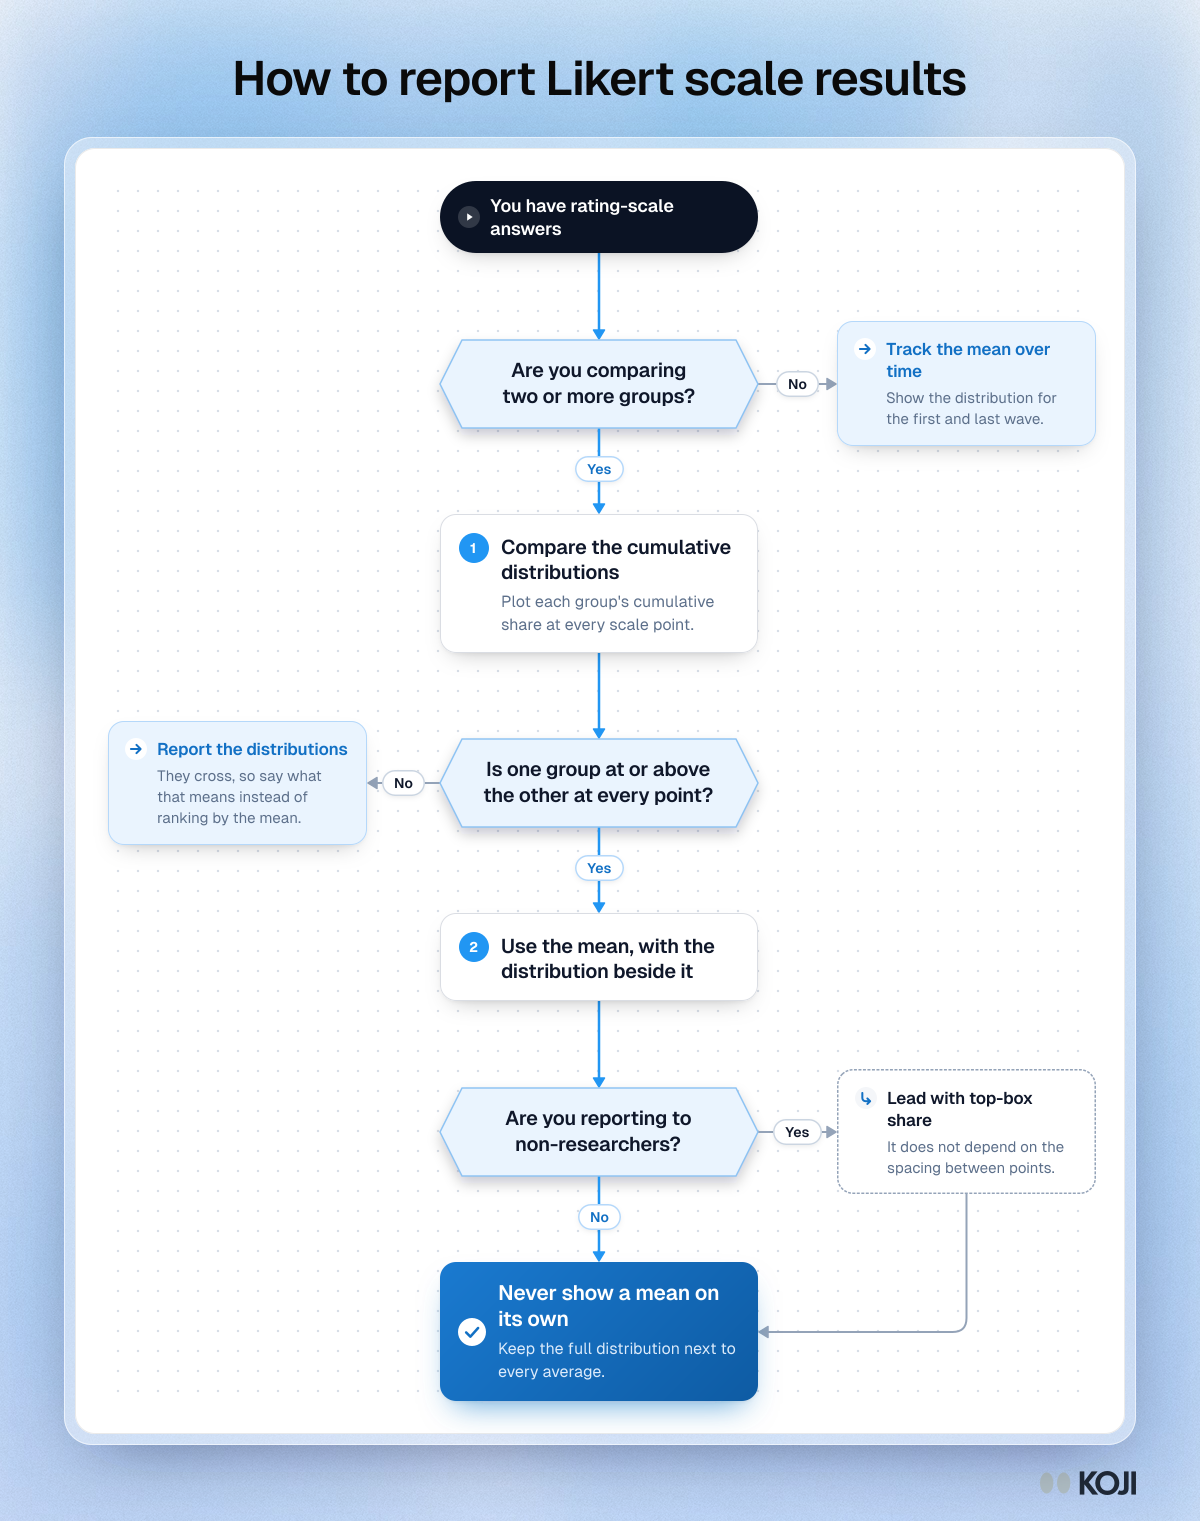
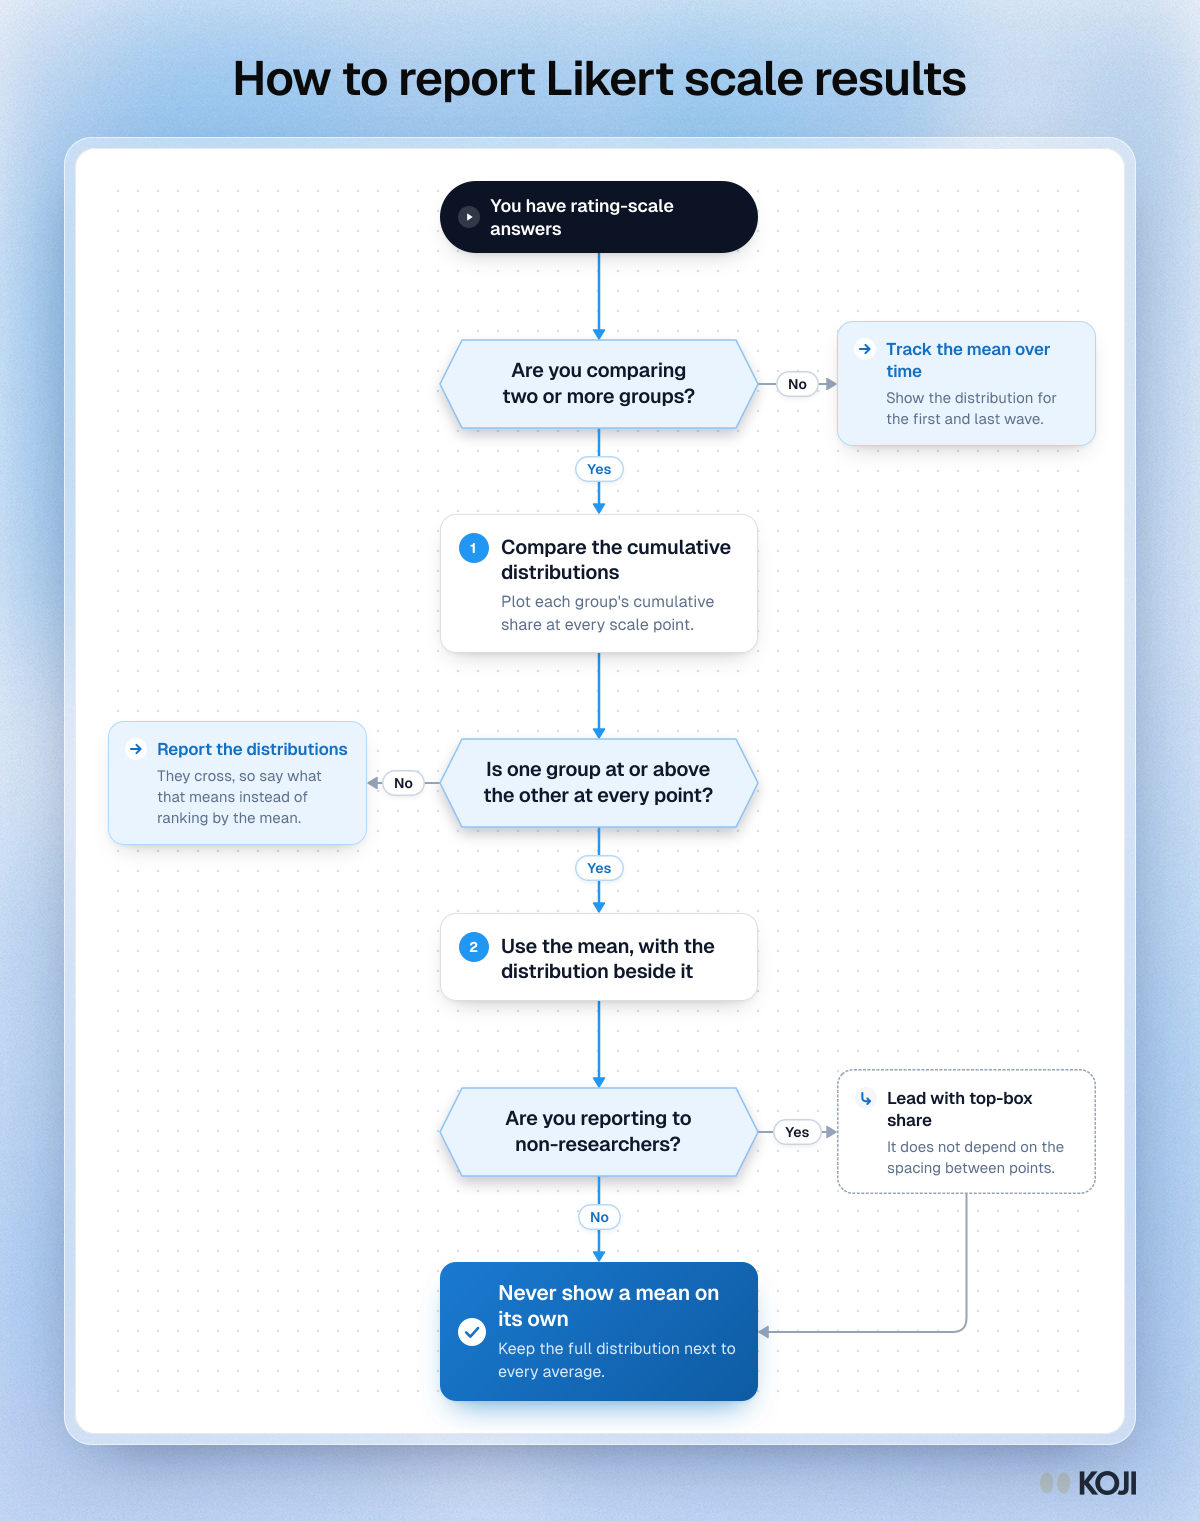
A decision flowchart for reporting rating-scale and Likert results. If you are tracking one group, use the mean with its distribution. If you compare groups, check whether their cumulative distributions cross before you trust the mean, and lead with top-box share for non-researchers. It follows the evidence from Norman (2010) and Liddell and Kruschke (2018).
Where this appears
What's in this flowchart
Start: You have rating-scale answers
- Are you comparing two or more groups?
- Yes: go to 2.
- No: Track the mean over time. Show the distribution for the first and last wave.
- Compare the cumulative distributions. Plot each group's cumulative share at every scale point.
- Is one group at or above the other at every point?
- Yes: go to 4.
- No: Report the distributions. They cross, so say what that means instead of ranking by the mean.
- Use the mean, with the distribution beside it.
- Are you reporting to non-researchers?
- No: go to 6.
- Yes: Lead with top-box share. It does not depend on the spacing between points. Then go to 6.
- Finish: Never show a mean on its own. Keep the full distribution next to every average.
Use this image
Free to use in your docs, decks and posts under CC BY 4.0, as long as you credit Koji with a link to this page. To embed it, paste this into your page:
html
<a href="https://www.koji.so/visuals/how-to-report-likert-scale-results-flowchart"><img src="https://www.koji.so/visuals/how-to-report-likert-scale-results-flowchart/how-to-report-likert-scale-results-flowchart.png" alt="Flowchart for reporting Likert results: three questions on groups, crossing distributions and audience, ending with the mean shown beside its distribution." width="1200" height="1521" /></a>
<p>Source: <a href="https://www.koji.so/visuals/how-to-report-likert-scale-results-flowchart">How to report Likert scale results</a>, Koji</p>