Reference table
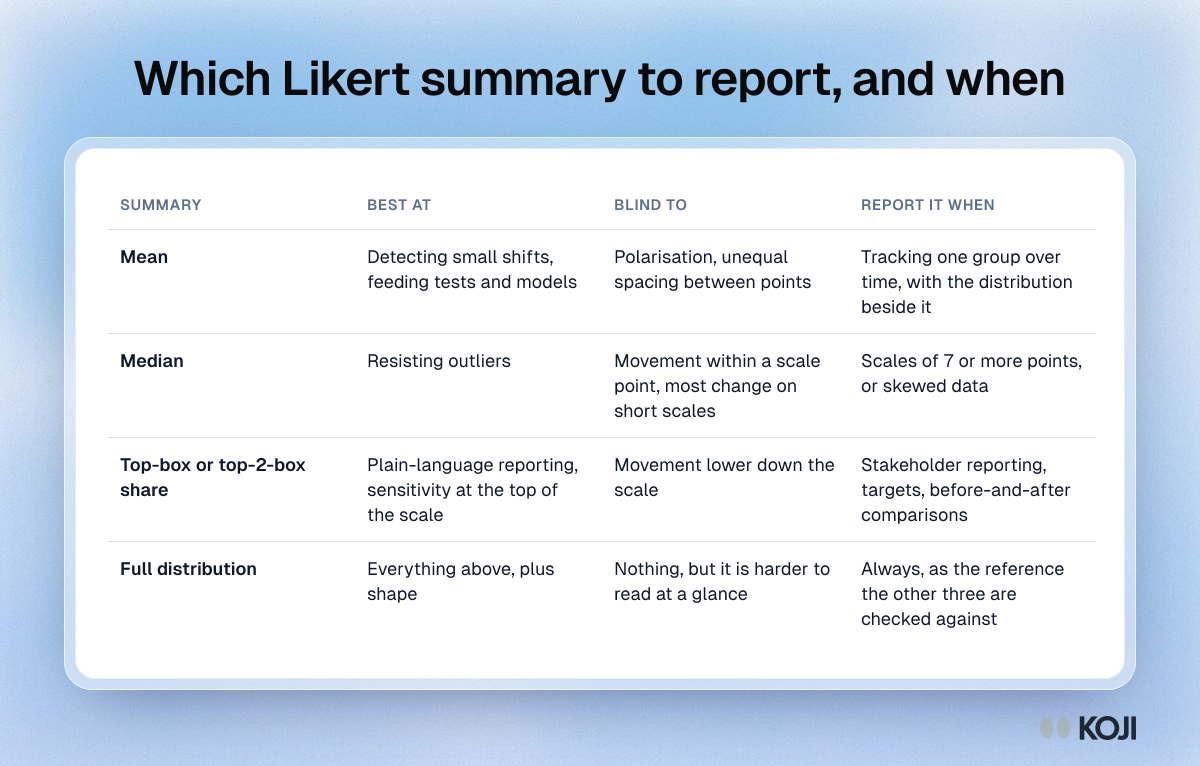
Which Likert summary to report, and when
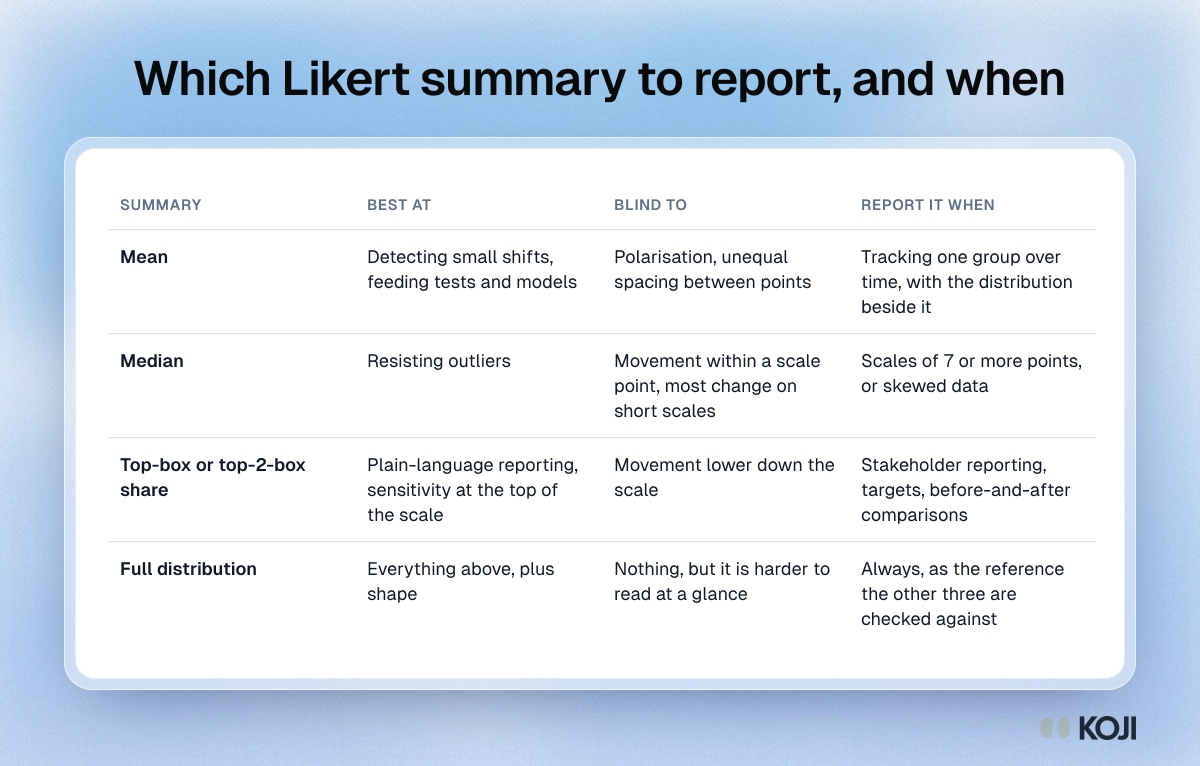
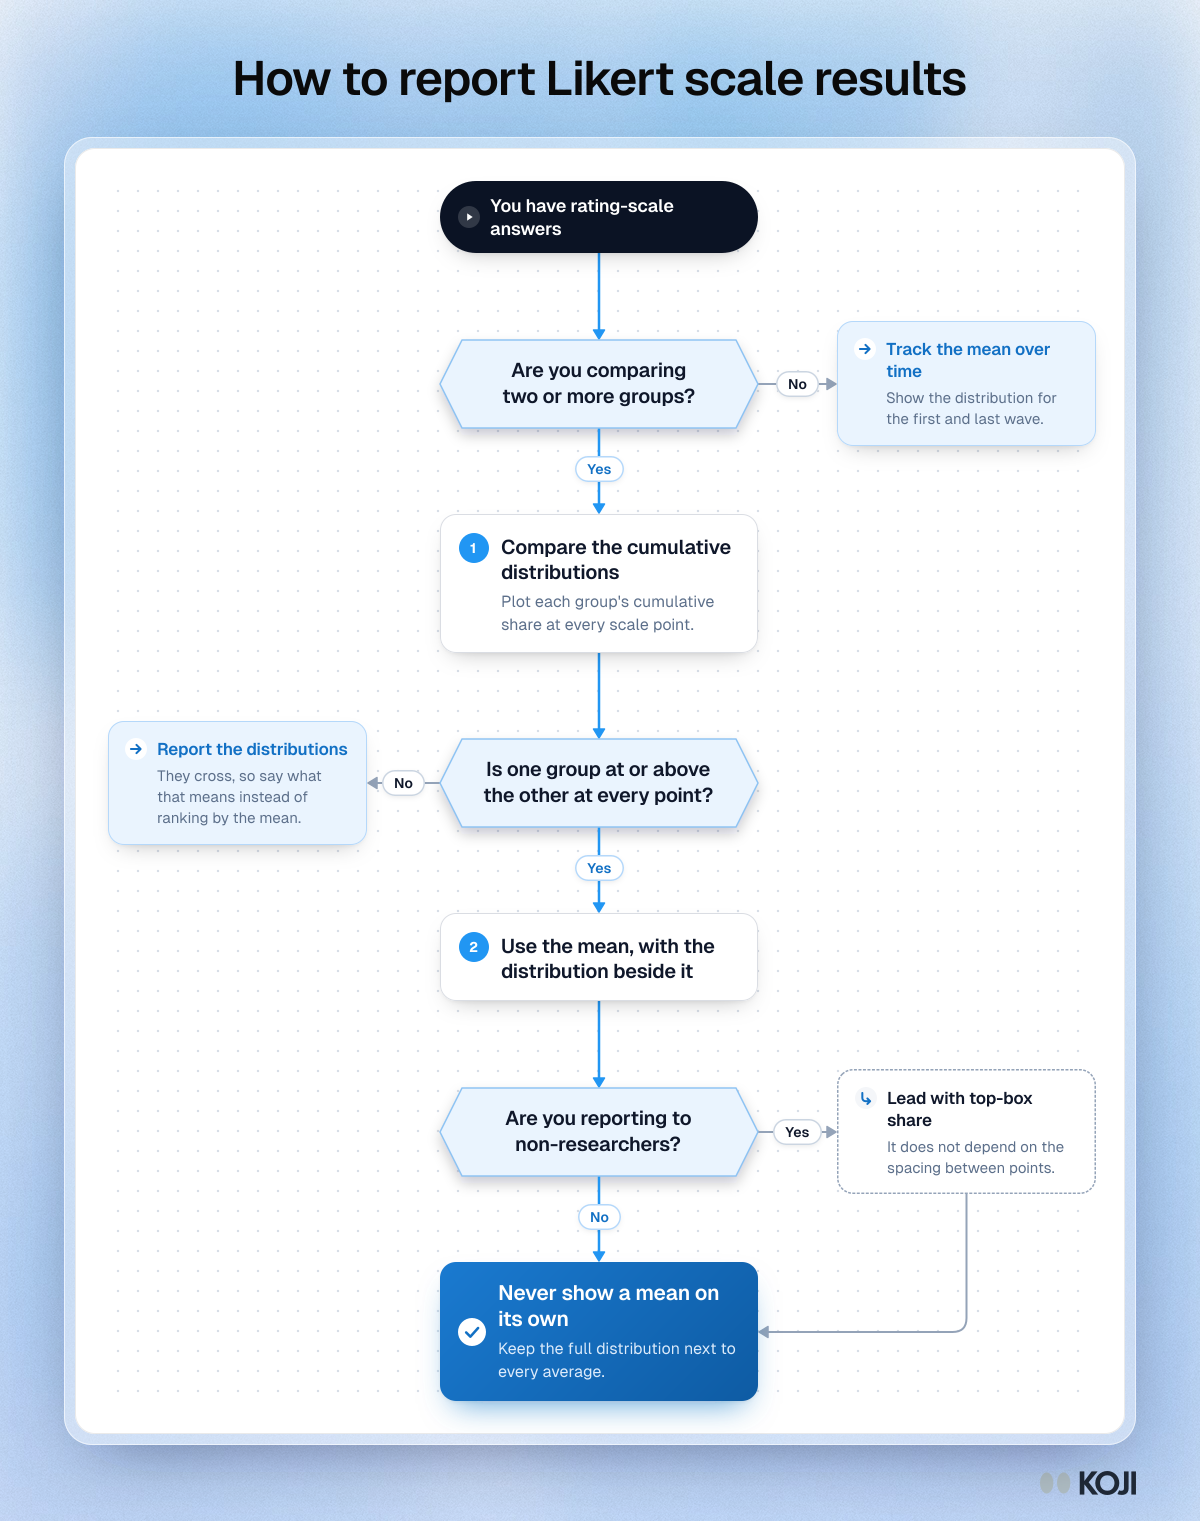
A guide to choosing a summary for Likert and rating-scale questions. It compares the mean, the median, top-box share and the full distribution on what each is good at, what it hides and when to report it. The default it points to: show the distribution, headline the top-box share, track the mean and add the median for long or skewed scales.
Where this appears
What's in this reference table
| Summary | Best at | Blind to | Report it when |
|---|---|---|---|
| Mean | Detecting small shifts, feeding tests and models | Polarisation, unequal spacing between points | Tracking one group over time, with the distribution beside it |
| Median | Resisting outliers | Movement within a scale point, most change on short scales | Scales of 7 or more points, or skewed data |
| Top-box or top-2-box share | Plain-language reporting, sensitivity at the top of the scale | Movement lower down the scale | Stakeholder reporting, targets, before-and-after comparisons |
| Full distribution | Everything above, plus shape | Nothing, but it is harder to read at a glance | Always, as the reference the other three are checked against |
Use this image
Free to use in your docs, decks and posts under CC BY 4.0, as long as you credit Koji with a link to this page. To embed it, paste this into your page:
html
<a href="https://www.koji.so/visuals/which-likert-summary-to-report-mean-median-top-box"><img src="https://www.koji.so/visuals/which-likert-summary-to-report-mean-median-top-box/which-likert-summary-to-report-mean-median-top-box.png" alt="Table comparing four ways to summarise Likert data, the mean, median, top-box share and full distribution, by what each catches and misses." width="1200" height="766" /></a>
<p>Source: <a href="https://www.koji.so/visuals/which-likert-summary-to-report-mean-median-top-box">Which Likert summary to report, and when</a>, Koji</p>