Reference table
Market share drop: which term moved and where to look
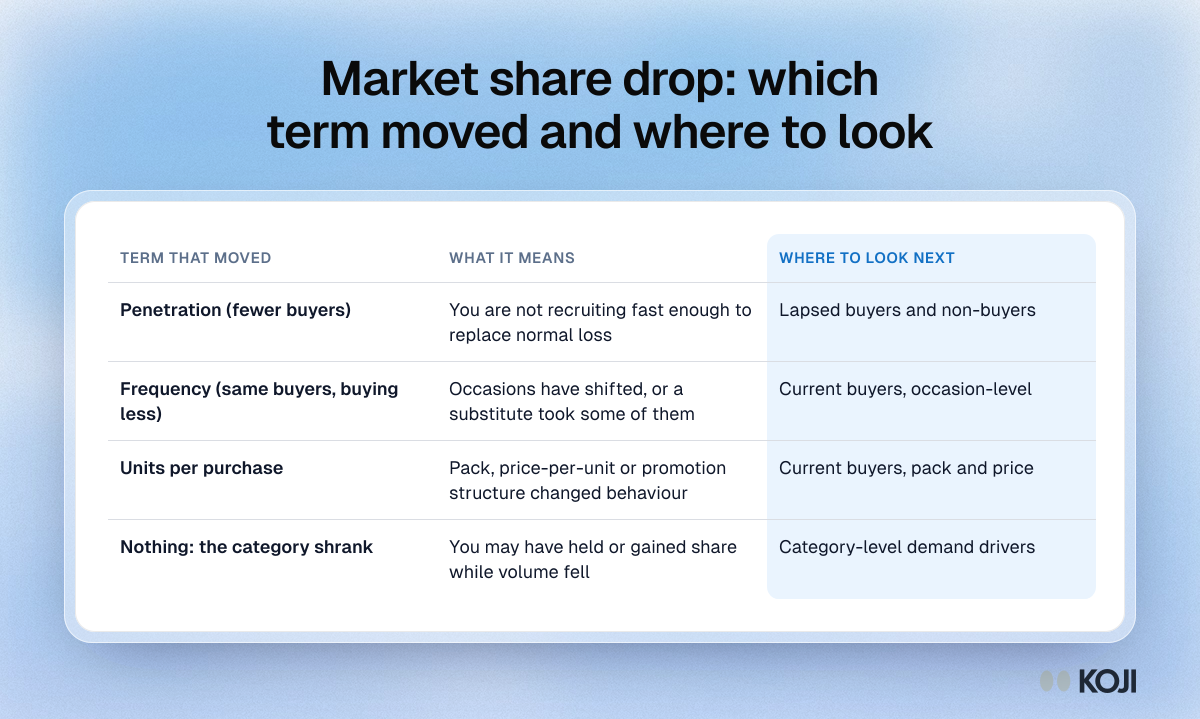
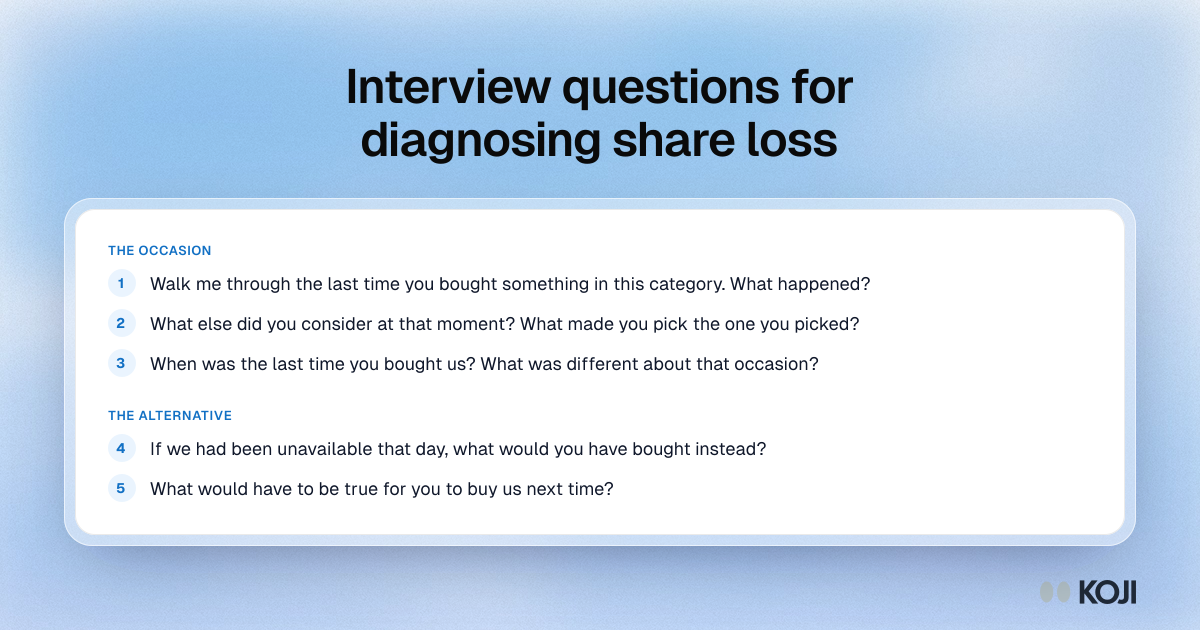
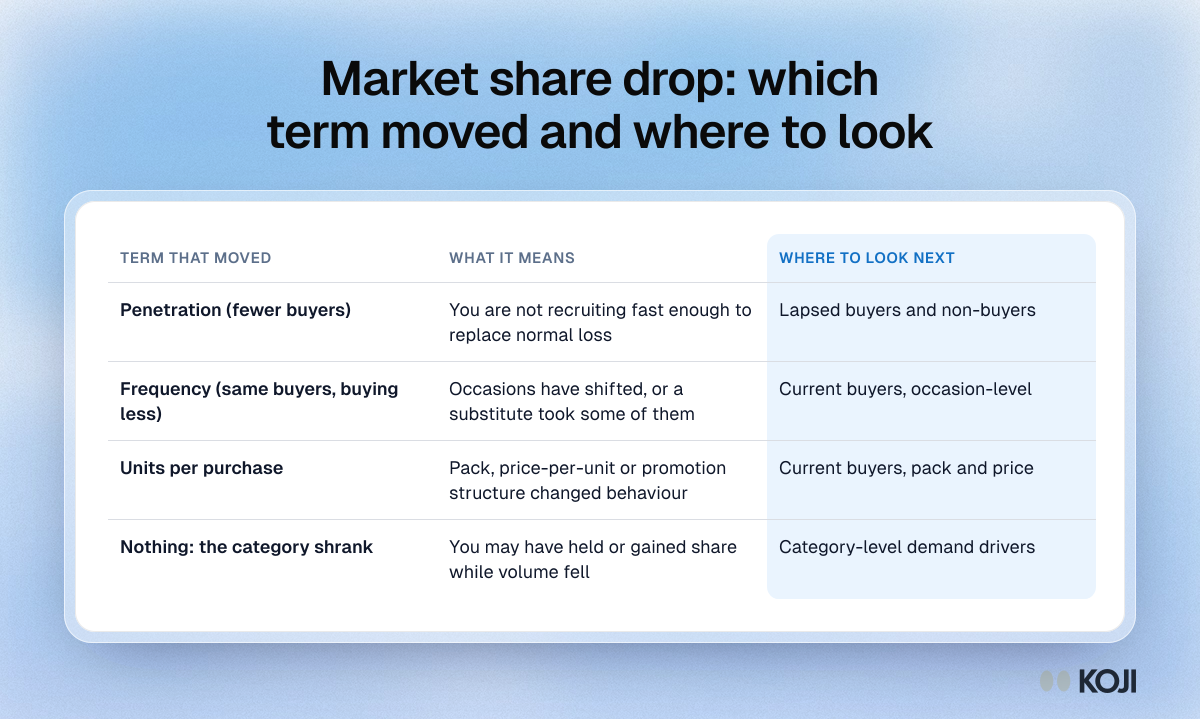
A table for decomposing a market share decline before diagnosing it. Volume is roughly buyers times purchases per buyer times units per purchase, so a drop comes from penetration, frequency, units per purchase or a shrinking category. The table says what each means and which people to study next. Household panel data can show which term moved; interviews explain why.
Where this appears
What's in this reference table
| Term that moved | What it means | Where to look next |
|---|---|---|
| Penetration (fewer buyers) | You are not recruiting fast enough to replace normal loss | Lapsed buyers and non-buyers |
| Frequency (same buyers, buying less) | Occasions have shifted, or a substitute took some of them | Current buyers, occasion-level |
| Units per purchase | Pack, price-per-unit or promotion structure changed behaviour | Current buyers, pack and price |
| Nothing: the category shrank | You may have held or gained share while volume fell | Category-level demand drivers |
Use this image
Free to use in your docs, decks and posts under CC BY 4.0, as long as you credit Koji with a link to this page. To embed it, paste this into your page:
html
<a href="https://www.koji.so/visuals/market-share-drop-decomposition-table"><img src="https://www.koji.so/visuals/market-share-drop-decomposition-table/market-share-drop-decomposition-table.png" alt="Table for diagnosing a market share drop: penetration, frequency, units per purchase or a shrinking category, with what each means and where to look next." width="1200" height="719" /></a>
<p>Source: <a href="https://www.koji.so/visuals/market-share-drop-decomposition-table">Market share drop: which term moved and where to look</a>, Koji</p>