Reference table
Marketplace data: what teams infer vs what it shows
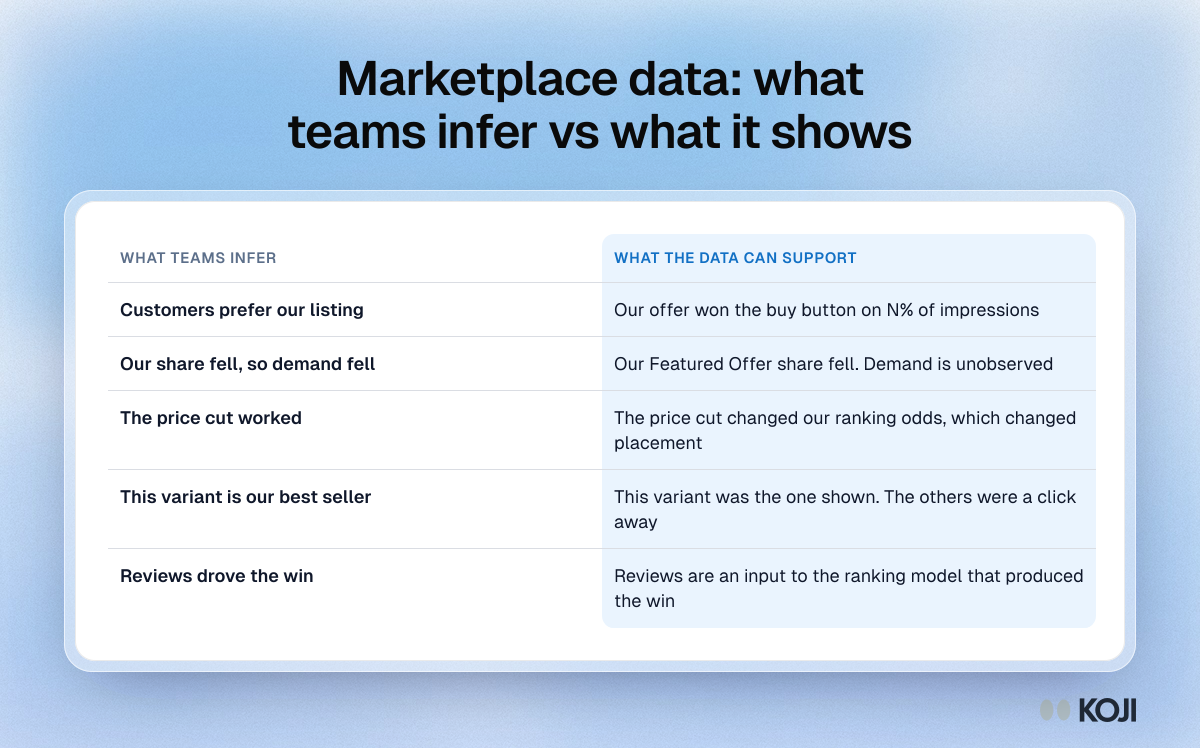
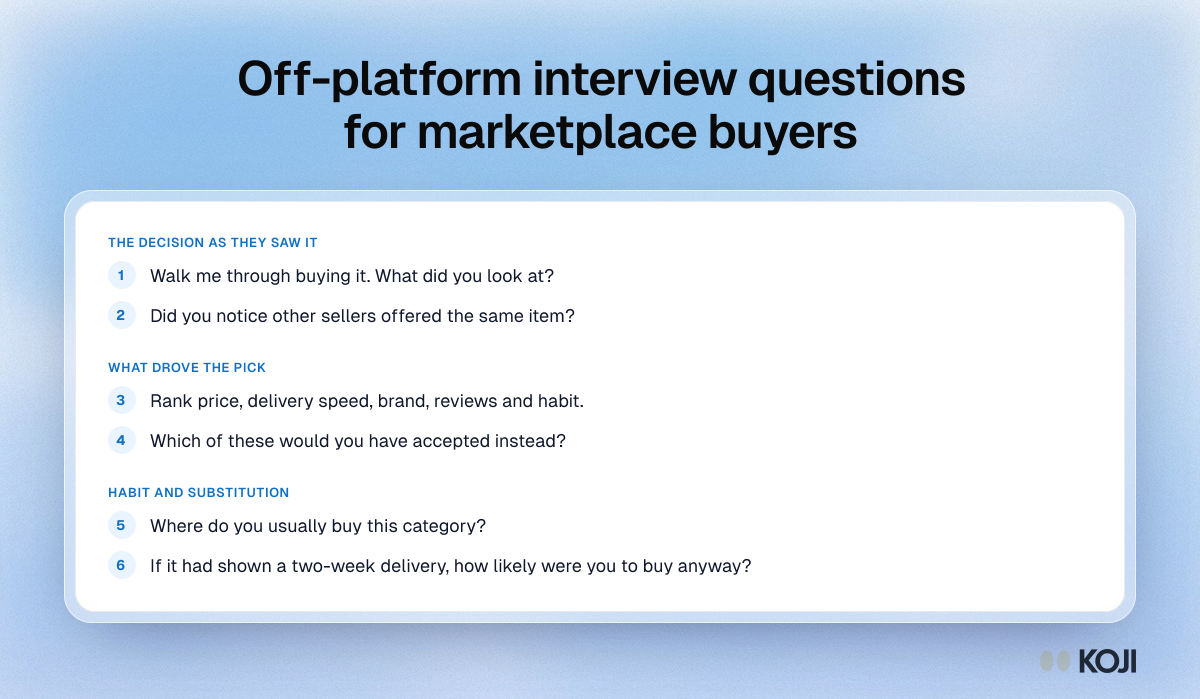
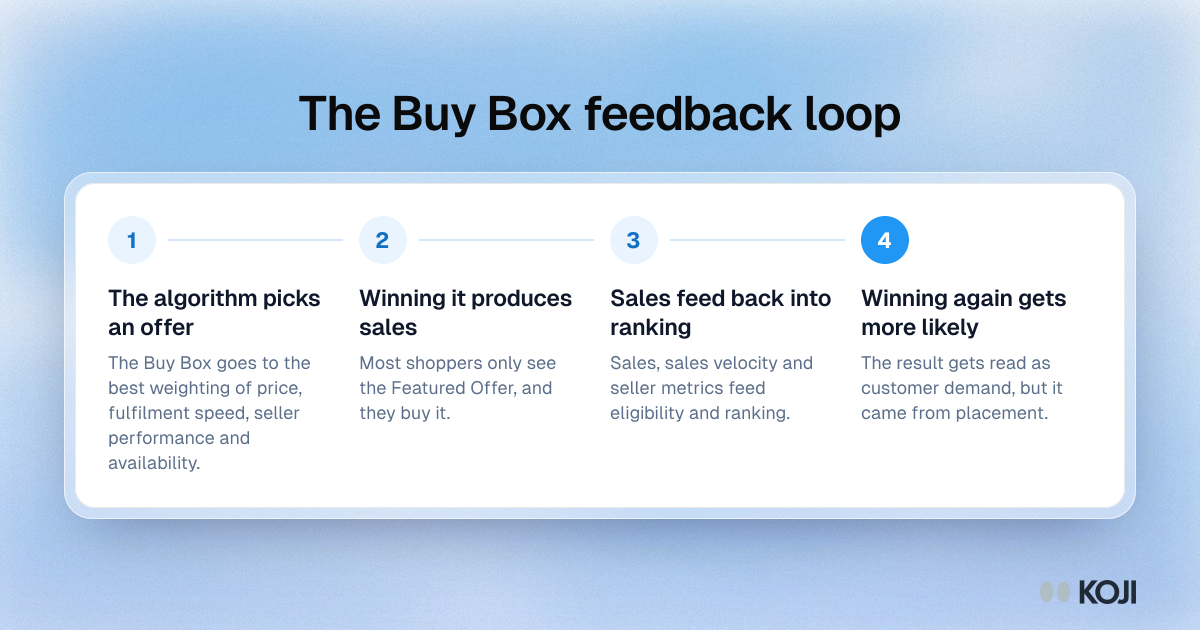
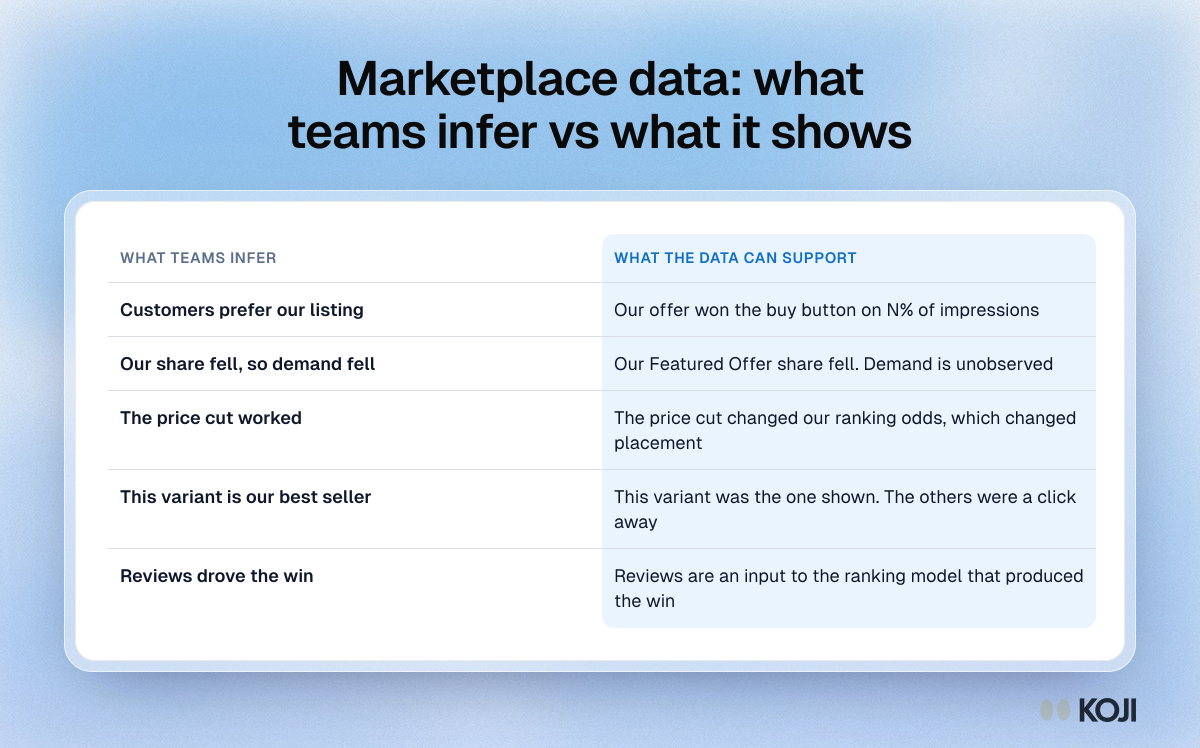
Five common readings of marketplace sales data, each set against what the data can really support. Claims about preference, demand, price response, best sellers and reviews turn out to be claims about the Buy Box algorithm. Use it to check a marketplace report before it reaches a pricing decision. To learn what buyers actually chose between, you have to ask them, which Koji does with AI-moderated interviews.
Where this appears
What's in this reference table
| What teams infer | What the data can support |
|---|---|
| Customers prefer our listing | Our offer won the buy button on N% of impressions |
| Our share fell, so demand fell | Our Featured Offer share fell. Demand is unobserved |
| The price cut worked | The price cut changed our ranking odds, which changed placement |
| This variant is our best seller | This variant was the one shown. The others were a click away |
| Reviews drove the win | Reviews are an input to the ranking model that produced the win |
Use this image
Free to use in your docs, decks and posts under CC BY 4.0, as long as you credit Koji with a link to this page. To embed it, paste this into your page:
html
<a href="https://www.koji.so/visuals/marketplace-sales-data-what-you-can-infer"><img src="https://www.koji.so/visuals/marketplace-sales-data-what-you-can-infer/marketplace-sales-data-what-you-can-infer.png" alt="Table contrasting five claims teams make from marketplace sales data with what that data can actually support." width="1200" height="748" /></a>
<p>Source: <a href="https://www.koji.so/visuals/marketplace-sales-data-what-you-can-infer">Marketplace data: what teams infer vs what it shows</a>, Koji</p>