Column chart
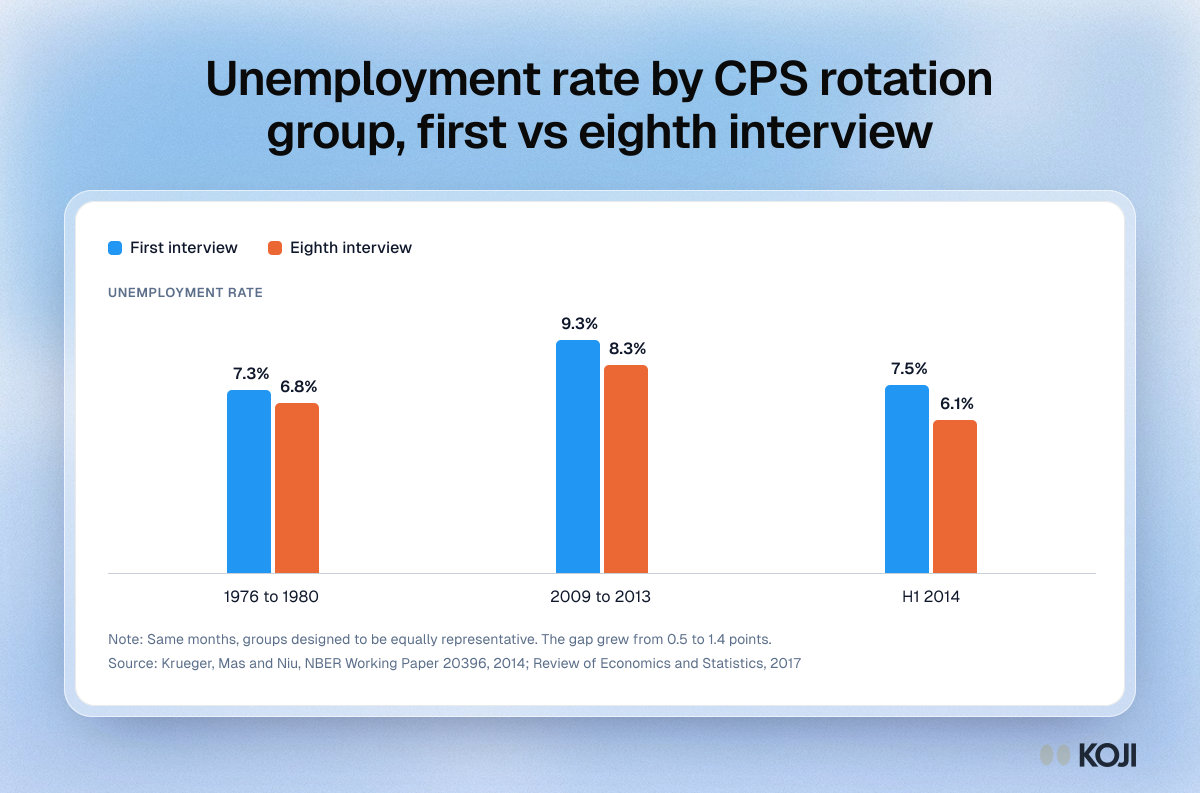
Unemployment rate by CPS rotation group, first vs eighth interview
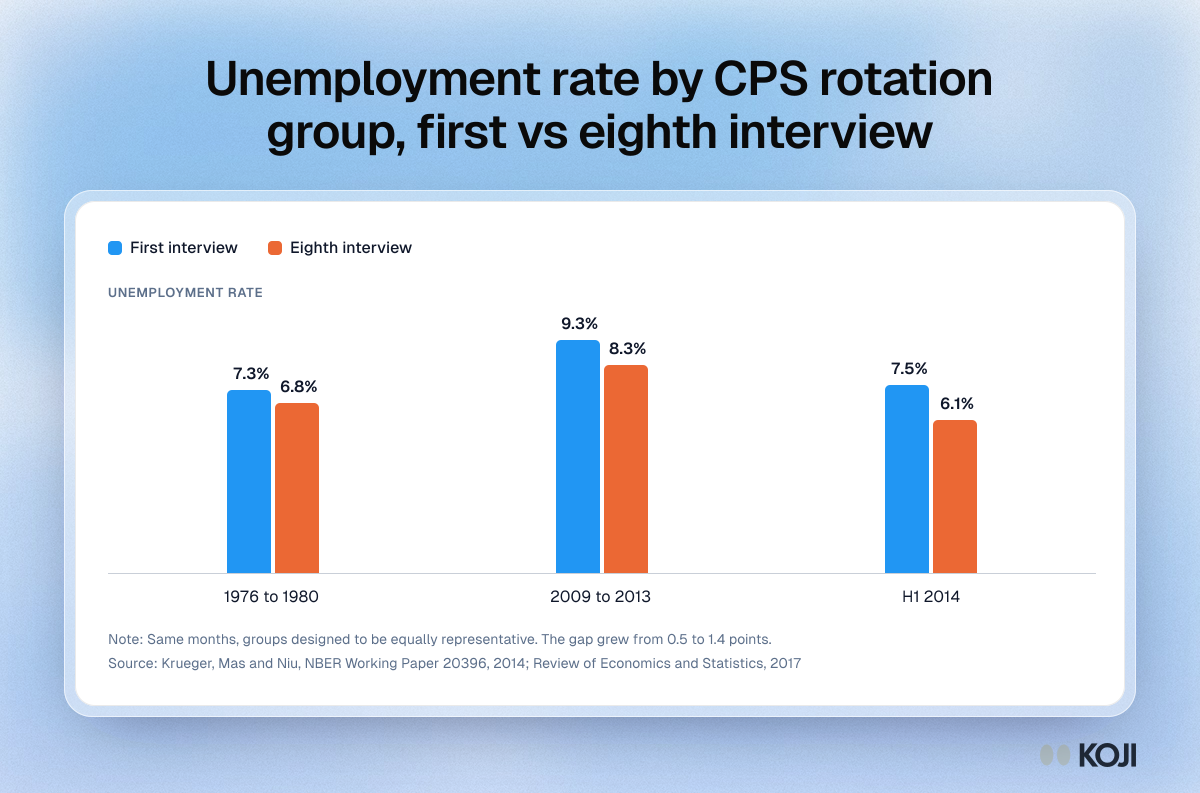
A column chart of rotation group bias in the US Current Population Survey: the unemployment rate reported by households in their first interview against those in their eighth, in the same months, for 1976 to 1980, 2009 to 2013 and the first half of 2014. The gap grew from 0.5 to 1.4 points, which makes it one of the clearest published examples of panel conditioning. Research teams can use it to explain why repeat participants need a fresh-cohort control.
Where this appears
What's in this column chart
| First interview | Eighth interview | |
|---|---|---|
| 1976 to 1980 | 7.3% | 6.8% |
| 2009 to 2013 | 9.3% | 8.3% |
| H1 2014 | 7.5% | 6.1% |
Same months, groups designed to be equally representative. The gap grew from 0.5 to 1.4 points.
Use this image
Free to use in your docs, decks and posts under CC BY 4.0, as long as you credit Koji with a link to this page. To embed it, paste this into your page:
html
<a href="https://www.koji.so/visuals/panel-conditioning-cps-rotation-group-unemployment"><img src="https://www.koji.so/visuals/panel-conditioning-cps-rotation-group-unemployment/panel-conditioning-cps-rotation-group-unemployment.png" alt="Column chart of the US unemployment rate reported by first-time and eighth-time CPS households: 7.3% vs 6.8%, 9.3% vs 8.3%, 7.5% vs 6.1%." width="1200" height="793" /></a>
<p>Source: <a href="https://www.koji.so/visuals/panel-conditioning-cps-rotation-group-unemployment">Unemployment rate by CPS rotation group, first vs eighth interview</a>, Koji</p>