Bar chart
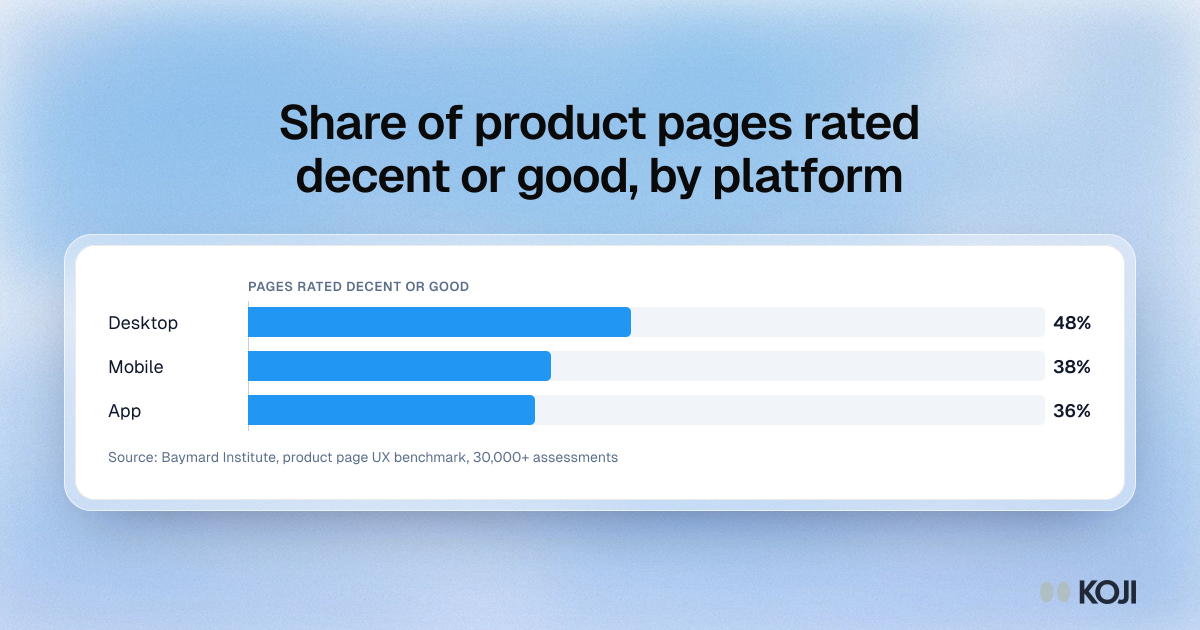
Share of product pages rated decent or good, by platform
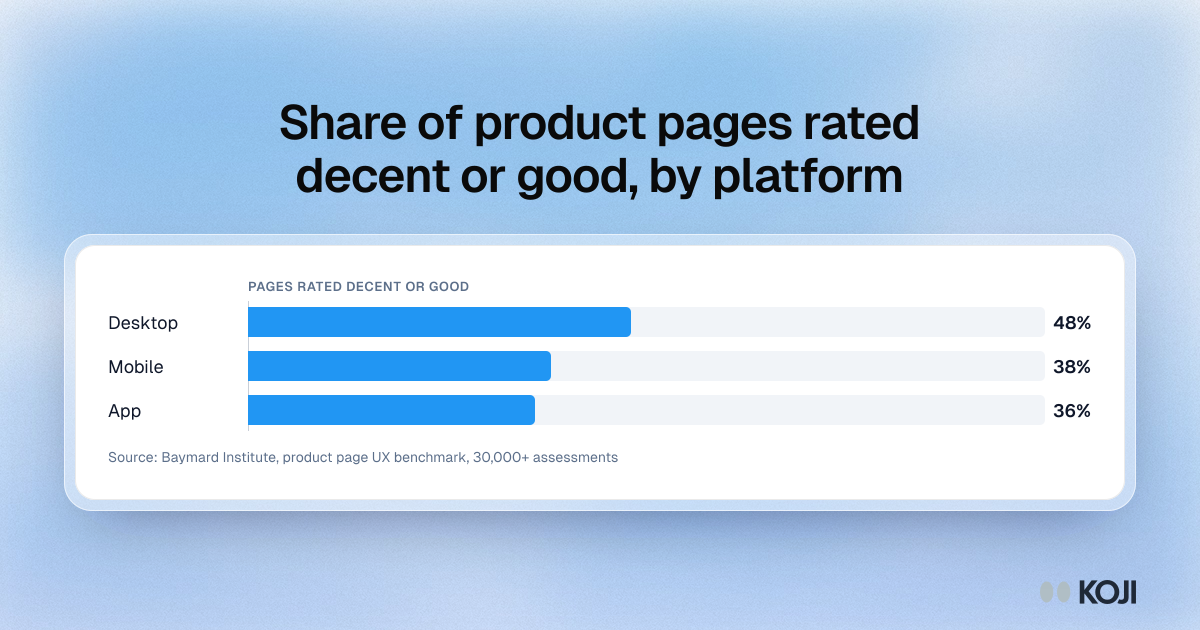
A bar chart from Baymard Institute's product page benchmark, built on more than 30,000 manually scored usability assessments across 155+ sites. Only 48% of desktop, 38% of mobile and 36% of app product pages scored decent or good. It matters for returns because the gaps are mostly missing information, such as the return policy or the total order cost, that leaves shoppers buying on a wrong assumption.
Where this appears
What's in this bar chart
| Rated decent or good | |
|---|---|
| Desktop | 48% |
| Mobile | 38% |
| App | 36% |
Use this image
Free to use in your docs, decks and posts under CC BY 4.0, as long as you credit Koji with a link to this page. To embed it, paste this into your page:
html
<a href="https://www.koji.so/visuals/product-page-ux-rated-decent-desktop-mobile-app"><img src="https://www.koji.so/visuals/product-page-ux-rated-decent-desktop-mobile-app/product-page-ux-rated-decent-desktop-mobile-app.png" alt="Bar chart of product pages Baymard Institute rated decent or good: 48% on desktop, 38% on mobile and 36% in apps." width="1200" height="630" /></a>
<p>Source: <a href="https://www.koji.so/visuals/product-page-ux-rated-decent-desktop-mobile-app">Share of product pages rated decent or good, by platform</a>, Koji</p>