Reference table
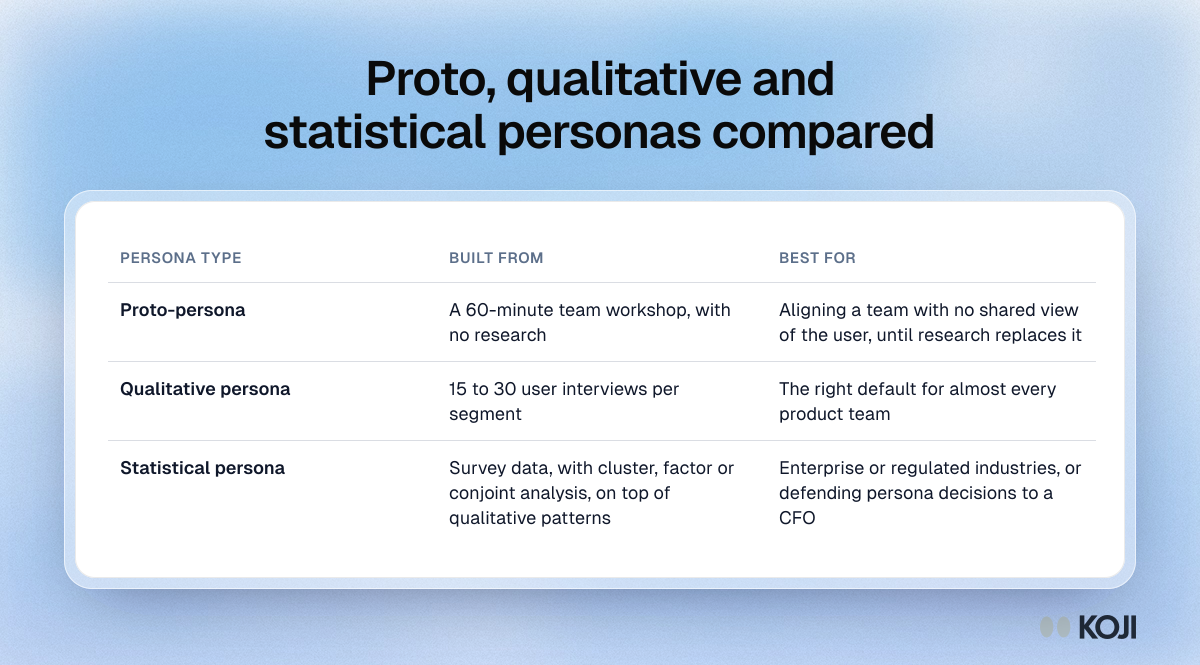
Proto, qualitative and statistical personas compared
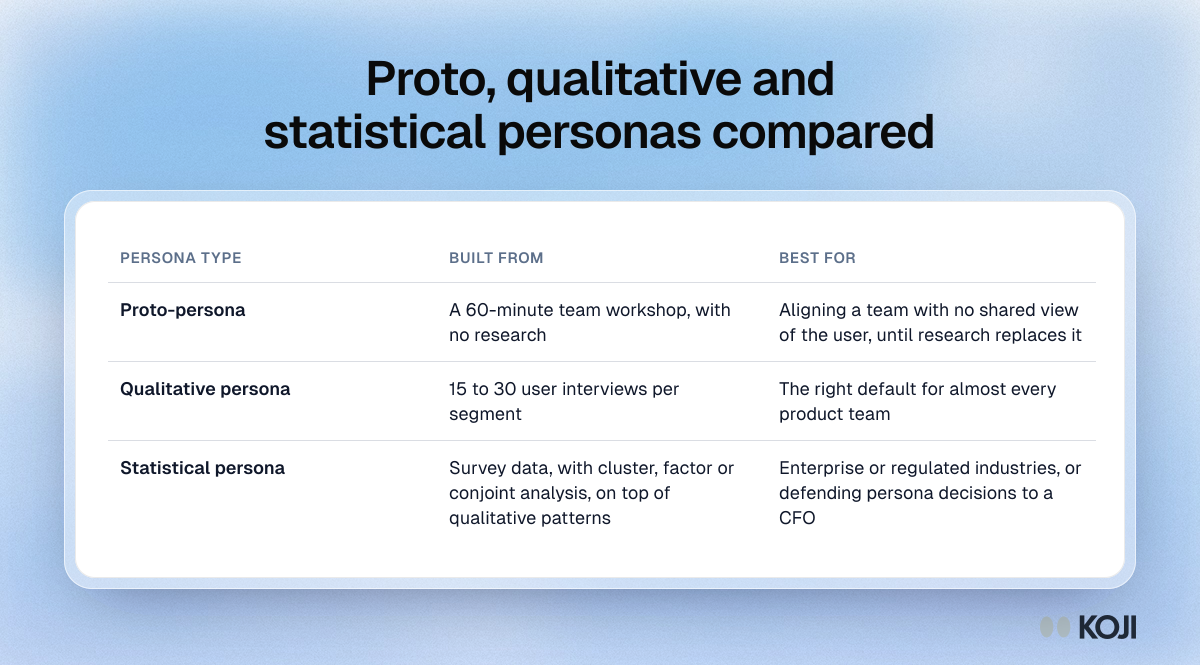
Three kinds of user persona side by side. Proto-personas come out of a short team workshop and are only a starting hypothesis. Qualitative personas come from 15 to 30 interviews per segment and suit most product teams. Statistical personas add survey analysis on top and fit large or regulated businesses. The three tiers follow Nielsen Norman Group.
Where this appears
What's in this reference table
| Persona type | Built from | Best for |
|---|---|---|
| Proto-persona | A 60-minute team workshop, with no research | Aligning a team with no shared view of the user, until research replaces it |
| Qualitative persona | 15 to 30 user interviews per segment | The right default for almost every product team |
| Statistical persona | Survey data, with cluster, factor or conjoint analysis, on top of qualitative patterns | Enterprise or regulated industries, or defending persona decisions to a CFO |
Use this image
Free to use in your docs, decks and posts under CC BY 4.0, as long as you credit Koji with a link to this page. To embed it, paste this into your page:
html
<a href="https://www.koji.so/visuals/proto-qualitative-statistical-personas-compared"><img src="https://www.koji.so/visuals/proto-qualitative-statistical-personas-compared/proto-qualitative-statistical-personas-compared.png" alt="Table comparing three kinds of user persona, proto, qualitative and statistical, by what each is built from and when to use it." width="1200" height="665" /></a>
<p>Source: <a href="https://www.koji.so/visuals/proto-qualitative-statistical-personas-compared">Proto, qualitative and statistical personas compared</a>, Koji</p>