Bar chart
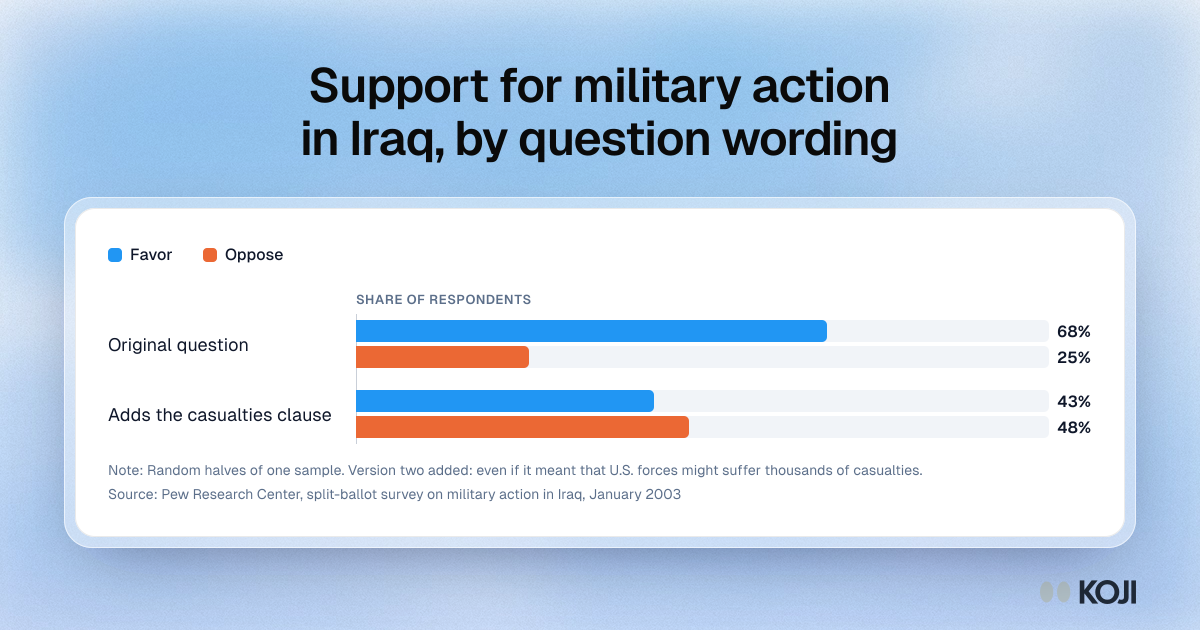
Support for military action in Iraq, by question wording
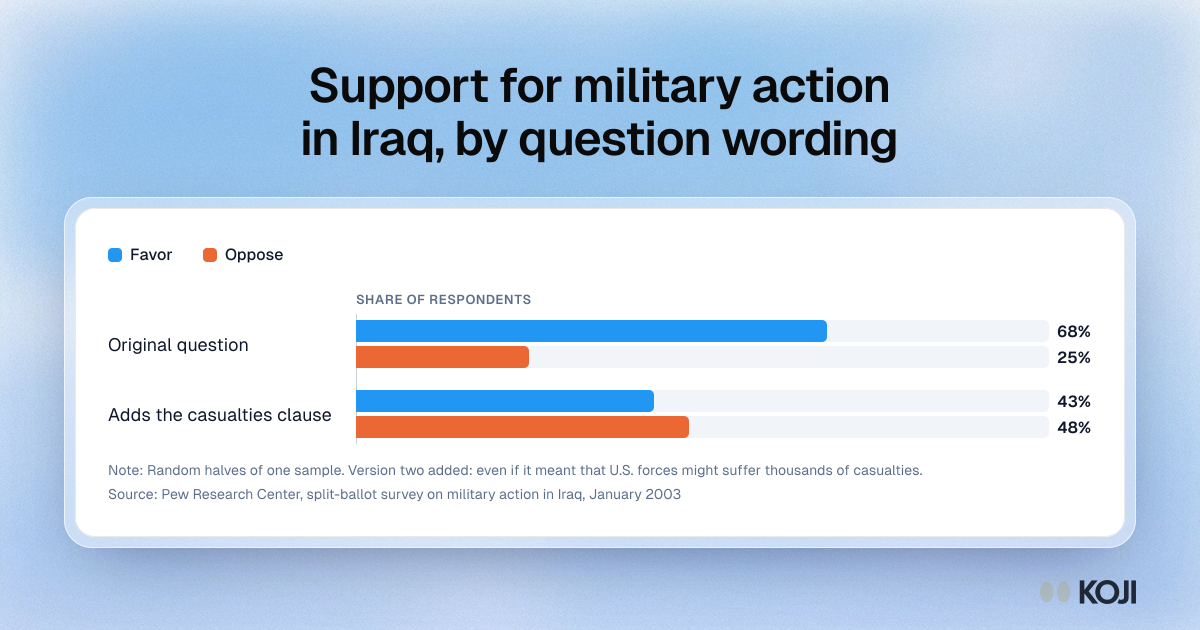
A bar chart of a classic split-ballot experiment by Pew Research Center in January 2003. Half the sample was asked about military action in Iraq, and the other half got the same question plus a clause about U.S. casualties. Support fell from 68% to 43% and opposition rose from 25% to 48%. Use it to show why the exact wording belongs next to any attitude percentage you report.
Where this appears
What's in this bar chart
| Favor | Oppose | |
|---|---|---|
| Original question | 68% | 25% |
| Adds the casualties clause | 43% | 48% |
Random halves of one sample. Version two added: even if it meant that U.S. forces might suffer thousands of casualties.
Use this image
Free to use in your docs, decks and posts under CC BY 4.0, as long as you credit Koji with a link to this page. To embed it, paste this into your page:
html
<a href="https://www.koji.so/visuals/question-wording-effect-pew-iraq-split-ballot-2003"><img src="https://www.koji.so/visuals/question-wording-effect-pew-iraq-split-ballot-2003/question-wording-effect-pew-iraq-split-ballot-2003.png" alt="Bar chart of a 2003 Pew split-ballot test: 68% favor and 25% oppose with the original question, 43% favor and 48% oppose with a casualties clause added." width="1200" height="630" /></a>
<p>Source: <a href="https://www.koji.so/visuals/question-wording-effect-pew-iraq-split-ballot-2003">Support for military action in Iraq, by question wording</a>, Koji</p>