Bar chart
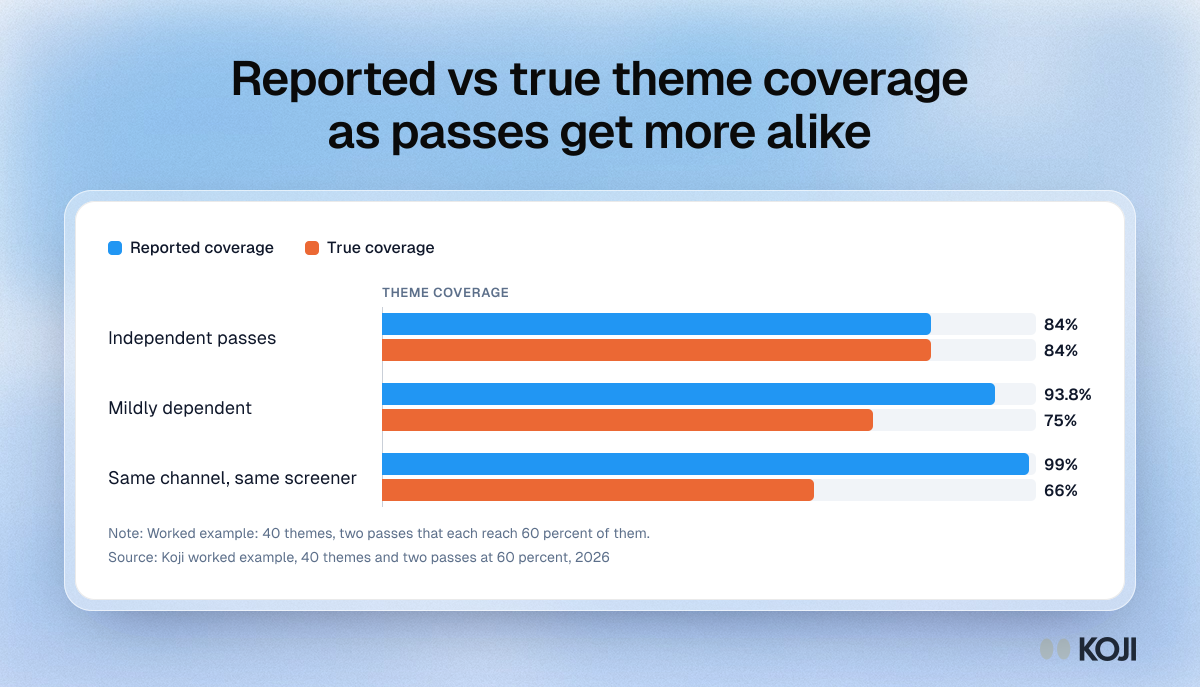
Reported vs true theme coverage as passes get more alike
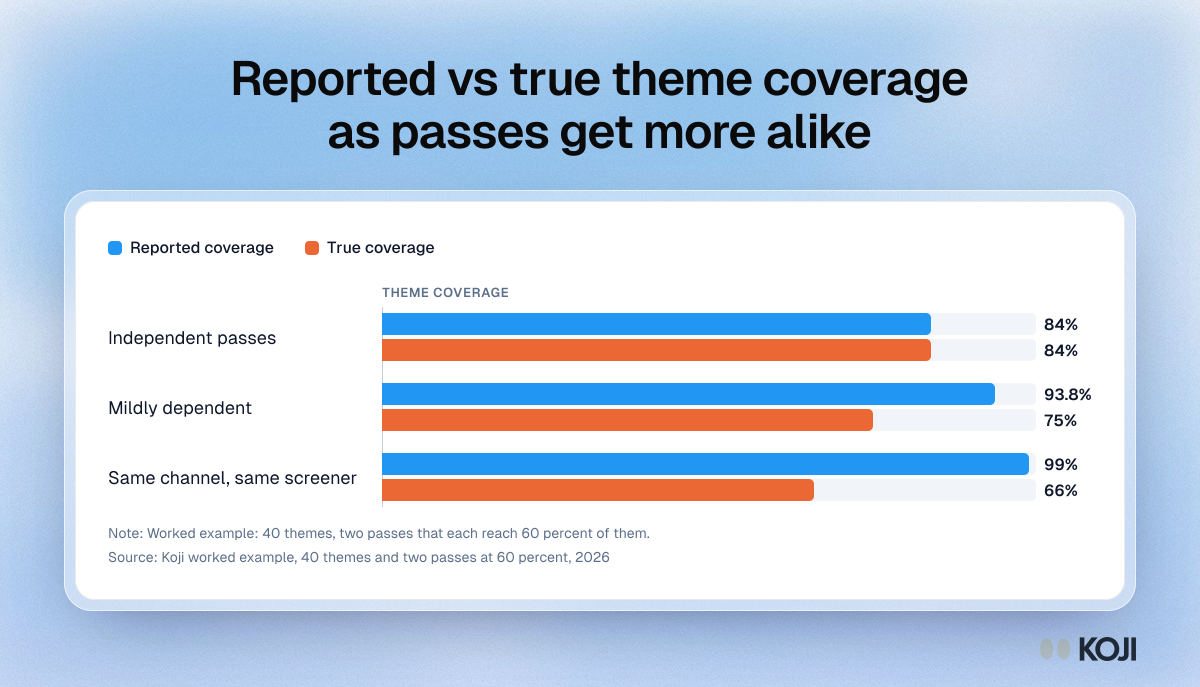
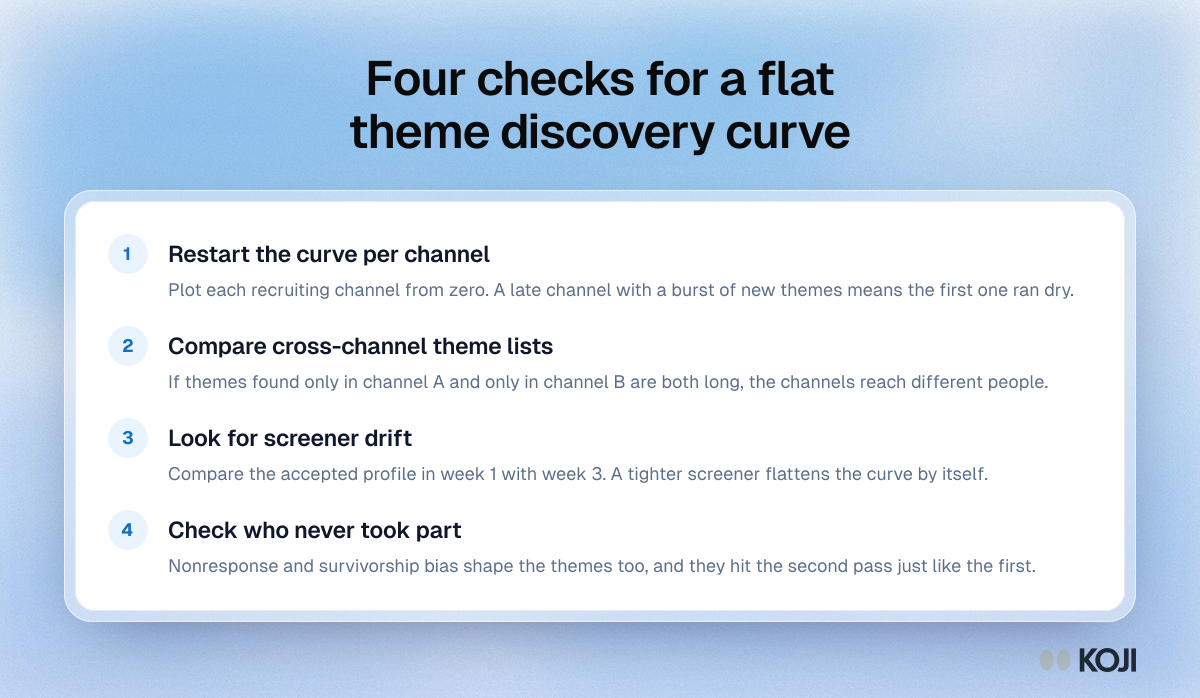
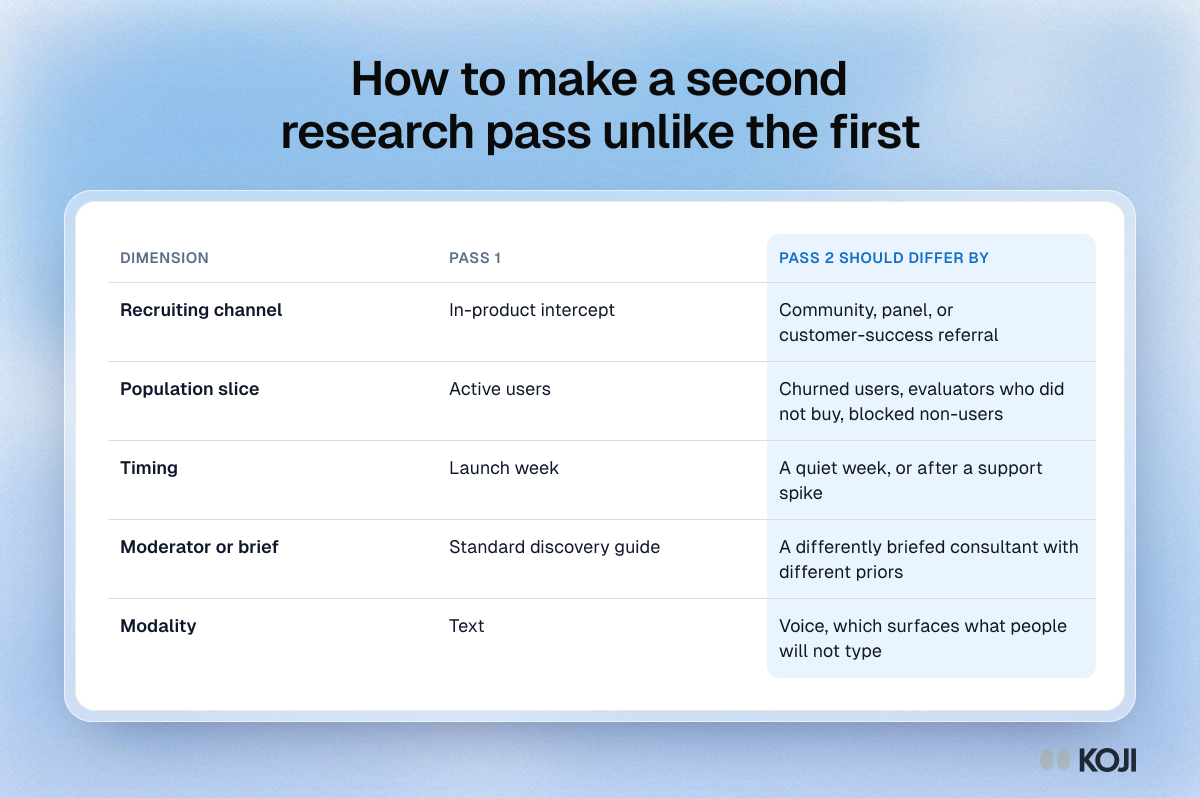
A worked example of correlation bias in capture-recapture estimates of qualitative theme coverage. With 40 themes and two passes that each reach 60 percent, independent passes report 84 percent coverage and are right. Passes from the same channel and screener report 99 percent while true coverage is 66 percent. Use it to explain why a flat theme discovery curve can mean narrow recruiting rather than saturation.
Where this appears
What's in this bar chart
| Reported coverage | True coverage | |
|---|---|---|
| Independent passes | 84% | 84% |
| Mildly dependent | 93.8% | 75% |
| Same channel, same screener | 99% | 66% |
Worked example: 40 themes, two passes that each reach 60 percent of them.
Use this image
Free to use in your docs, decks and posts under CC BY 4.0, as long as you credit Koji with a link to this page. To embed it, paste this into your page:
html
<a href="https://www.koji.so/visuals/reported-vs-true-theme-coverage-by-sample-dependence"><img src="https://www.koji.so/visuals/reported-vs-true-theme-coverage-by-sample-dependence/reported-vs-true-theme-coverage-by-sample-dependence.png" alt="Bar chart of theme coverage: as two research passes get more alike, reported coverage rises from 84 to 99% while true coverage falls to 66%." width="1200" height="687" /></a>
<p>Source: <a href="https://www.koji.so/visuals/reported-vs-true-theme-coverage-by-sample-dependence">Reported vs true theme coverage as passes get more alike</a>, Koji</p>