Reference table
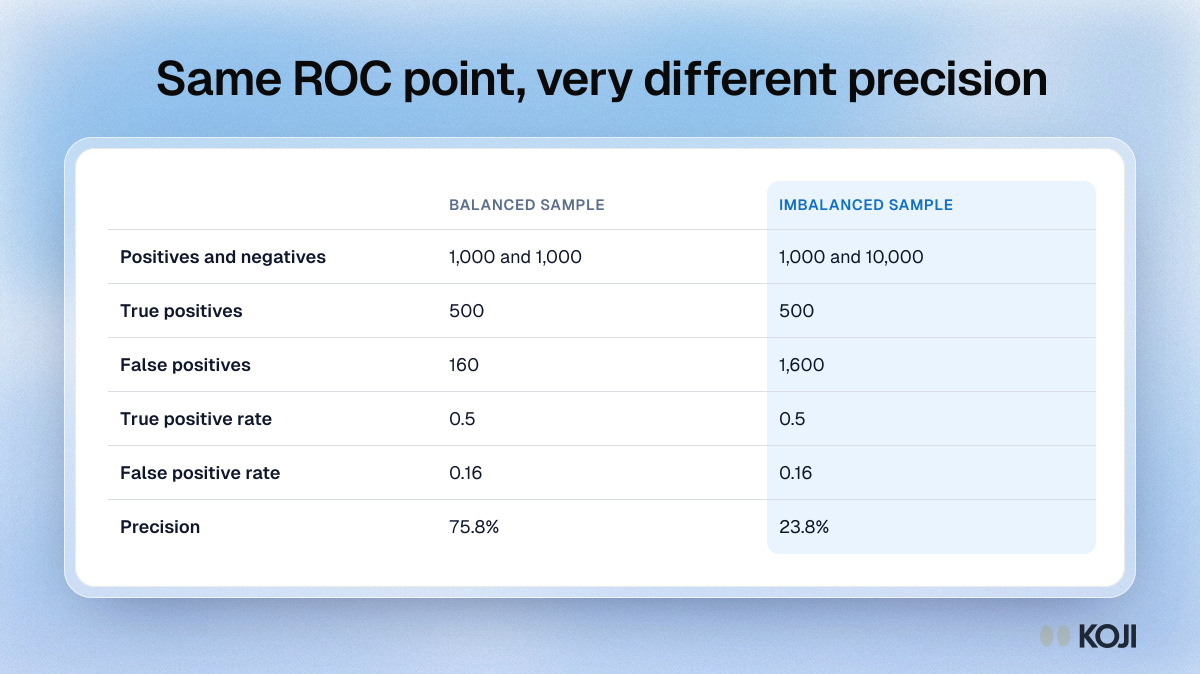
Same ROC point, very different precision
Why ROC curves and AUC look unchanged on imbalanced data
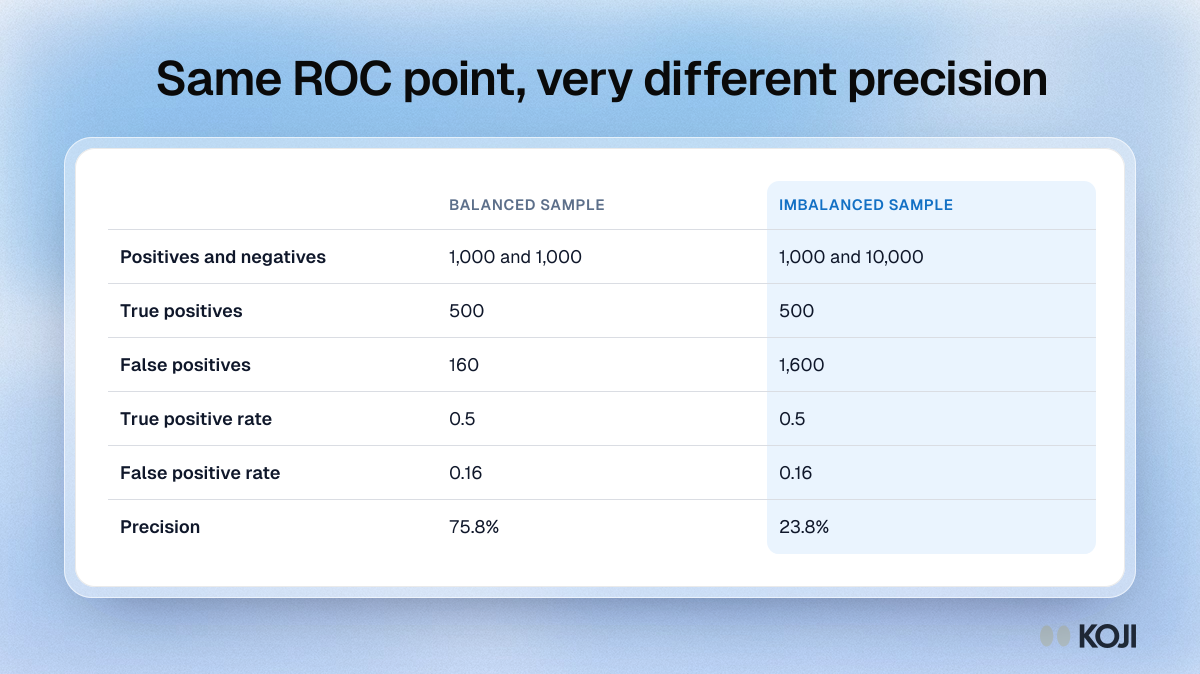
A table from the Saito and Rehmsmeier simulation in PLOS ONE (2015). At one operating point, a classifier on a balanced sample of 1,000 positives and 1,000 negatives and on an imbalanced sample of 1,000 positives and 10,000 negatives has the same true positive rate of 0.5 and false positive rate of 0.16, so the ROC curve and AUC do not move. Precision goes from 75.8% to 23.8%. Use it to explain why precision-recall plots suit rare classes better than ROC.
Where this appears
What's in this reference table
| Balanced sample | Imbalanced sample | |
|---|---|---|
| Positives and negatives | 1,000 and 1,000 | 1,000 and 10,000 |
| True positives | 500 | 500 |
| False positives | 160 | 1,600 |
| True positive rate | 0.5 | 0.5 |
| False positive rate | 0.16 | 0.16 |
| Precision | 75.8% | 23.8% |
Use this image
Free to use in your docs, decks and posts under CC BY 4.0, as long as you credit Koji with a link to this page. To embed it, paste this into your page:
html
<a href="https://www.koji.so/visuals/same-roc-point-different-precision-saito-rehmsmeier"><img src="https://www.koji.so/visuals/same-roc-point-different-precision-saito-rehmsmeier/same-roc-point-different-precision-saito-rehmsmeier.png" alt="Table comparing a balanced and an imbalanced sample at one ROC point: the same true and false positive rates, but precision falls from 75.8% to 23.8%." width="1200" height="674" /></a>
<p>Source: <a href="https://www.koji.so/visuals/same-roc-point-different-precision-saito-rehmsmeier">Same ROC point, very different precision</a>, Koji</p>