Column chart
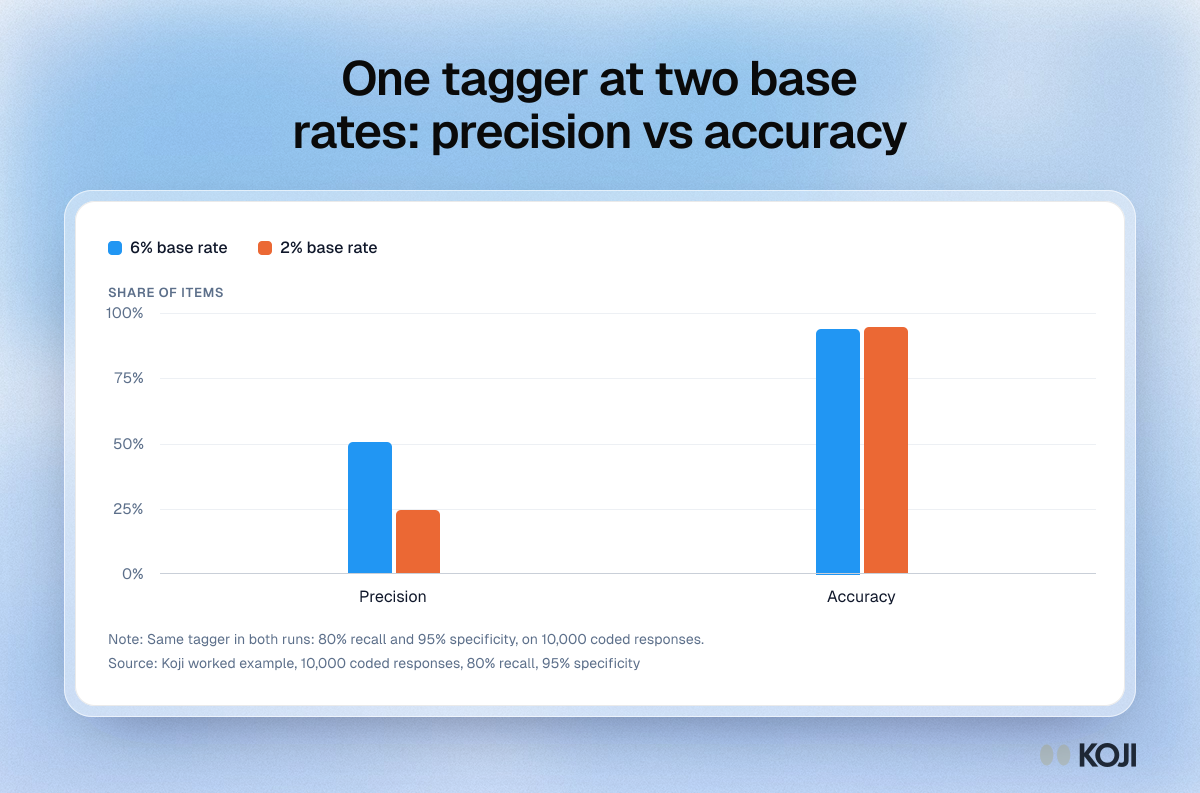
One tagger at two base rates: precision vs accuracy
When the class gets rarer, precision halves and accuracy goes up
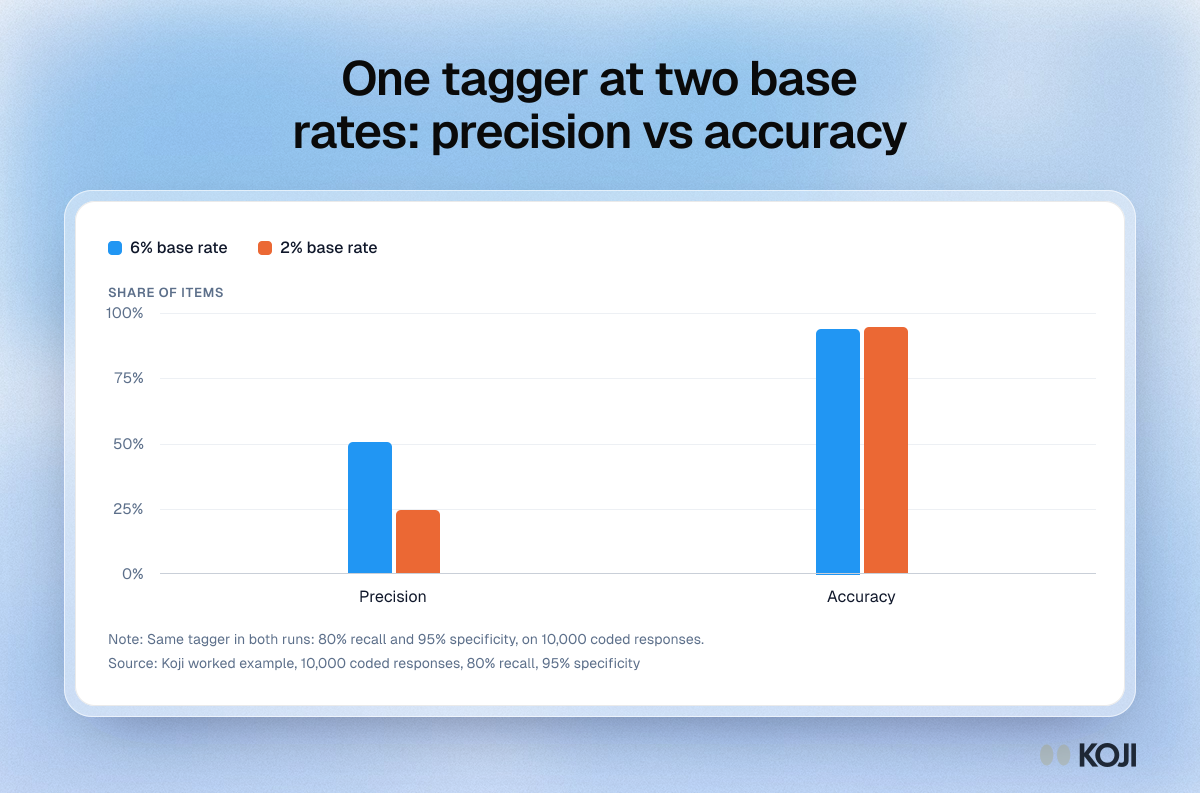
A column chart from a worked example of an AI tagger with 80% recall and 95% specificity, run on 10,000 coded interview responses. When feature requests make up 6% of the stream, precision is 50.5% and accuracy 94.1%. At a 2% base rate, precision drops to 24.6% while accuracy rises to 94.7%. It shows why accuracy is the wrong number to read for a rare class. Koji keeps every tag traceable to its transcript so teams can audit precision themselves.
Where this appears
What's in this column chart
| 6% base rate | 2% base rate | |
|---|---|---|
| Precision | 50.5% | 24.6% |
| Accuracy | 94.1% | 94.7% |
Same tagger in both runs: 80% recall and 95% specificity, on 10,000 coded responses.
Use this image
Free to use in your docs, decks and posts under CC BY 4.0, as long as you credit Koji with a link to this page. To embed it, paste this into your page:
<a href="https://www.koji.so/visuals/classifier-precision-vs-accuracy-by-base-rate"><img src="https://www.koji.so/visuals/classifier-precision-vs-accuracy-by-base-rate/classifier-precision-vs-accuracy-by-base-rate.png" alt="Column chart of one tagger at a 6% and a 2% base rate: precision falls from 50.5% to 24.6% while accuracy rises from 94.1% to 94.7%." width="1200" height="793" /></a>
<p>Source: <a href="https://www.koji.so/visuals/classifier-precision-vs-accuracy-by-base-rate">One tagger at two base rates: precision vs accuracy</a>, Koji</p>