Column chart
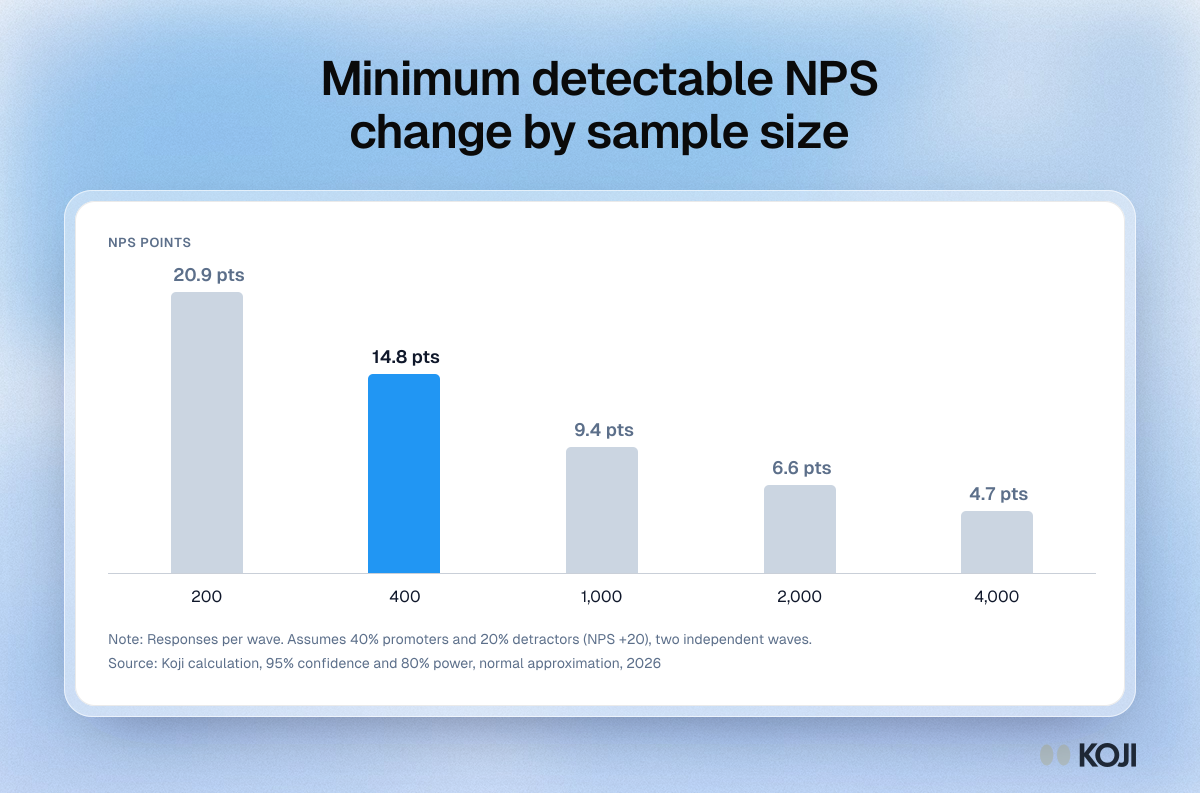
Minimum detectable NPS change by sample size
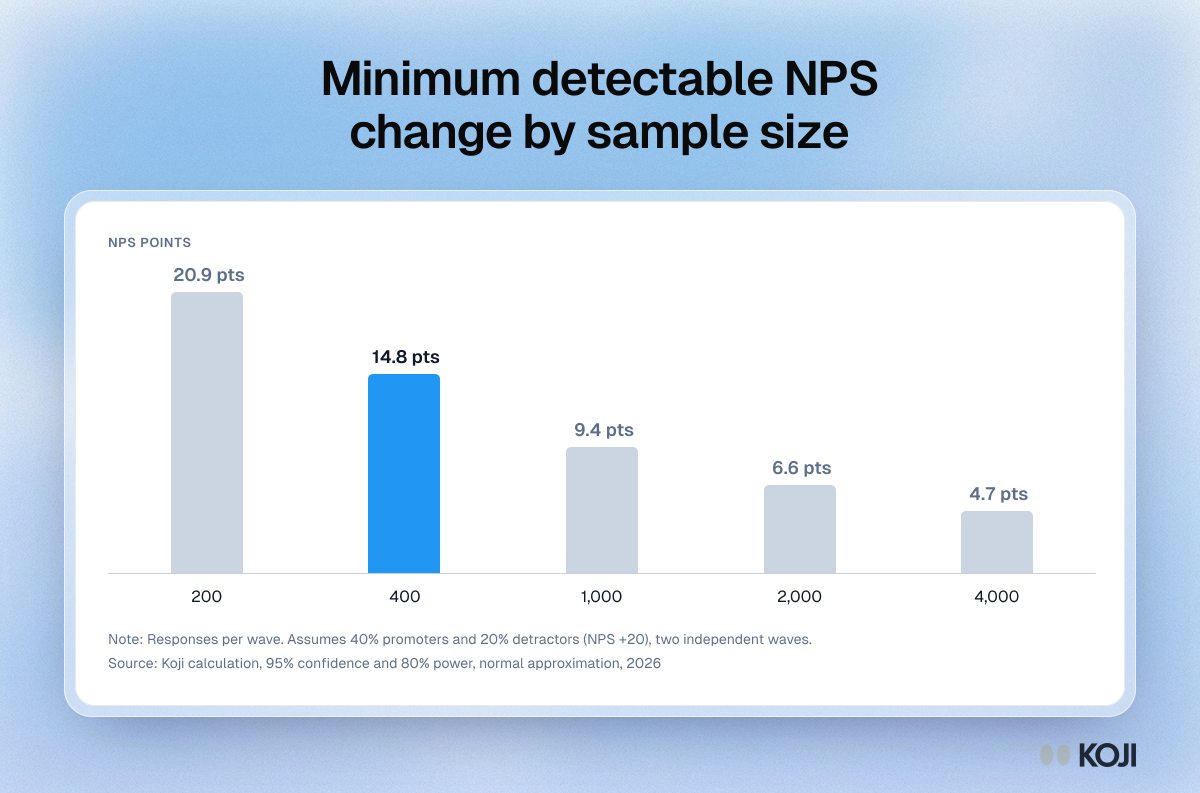
The smallest change in Net Promoter Score you can reliably detect between two survey waves, for 200 to 4,000 responses per wave. It assumes 40% promoters and 20% detractors, 95% confidence and 80% power. Because NPS is the gap between two proportions, it is noisier than people expect: a typical 400-response tracker needs a move of about 15 points. Use it before reading meaning into a quarterly NPS shift. Koji pairs the score with a follow-up on why people gave it.
Where this appears
What's in this column chart
| Detectable NPS change | |
|---|---|
| 200 | 20.9 pts |
| 400 | 14.8 pts |
| 1,000 | 9.4 pts |
| 2,000 | 6.6 pts |
| 4,000 | 4.7 pts |
Responses per wave. Assumes 40% promoters and 20% detractors (NPS +20), two independent waves.
Use this image
Free to use in your docs, decks and posts under CC BY 4.0, as long as you credit Koji with a link to this page. To embed it, paste this into your page:
html
<a href="https://www.koji.so/visuals/minimum-detectable-nps-change-by-sample-size"><img src="https://www.koji.so/visuals/minimum-detectable-nps-change-by-sample-size/minimum-detectable-nps-change-by-sample-size.png" alt="Column chart of the smallest NPS change two survey waves can detect: 20.9 points at 200 responses, 14.8 at 400, down to 4.7 at 4,000." width="1200" height="793" /></a>
<p>Source: <a href="https://www.koji.so/visuals/minimum-detectable-nps-change-by-sample-size">Minimum detectable NPS change by sample size</a>, Koji</p>