Column chart
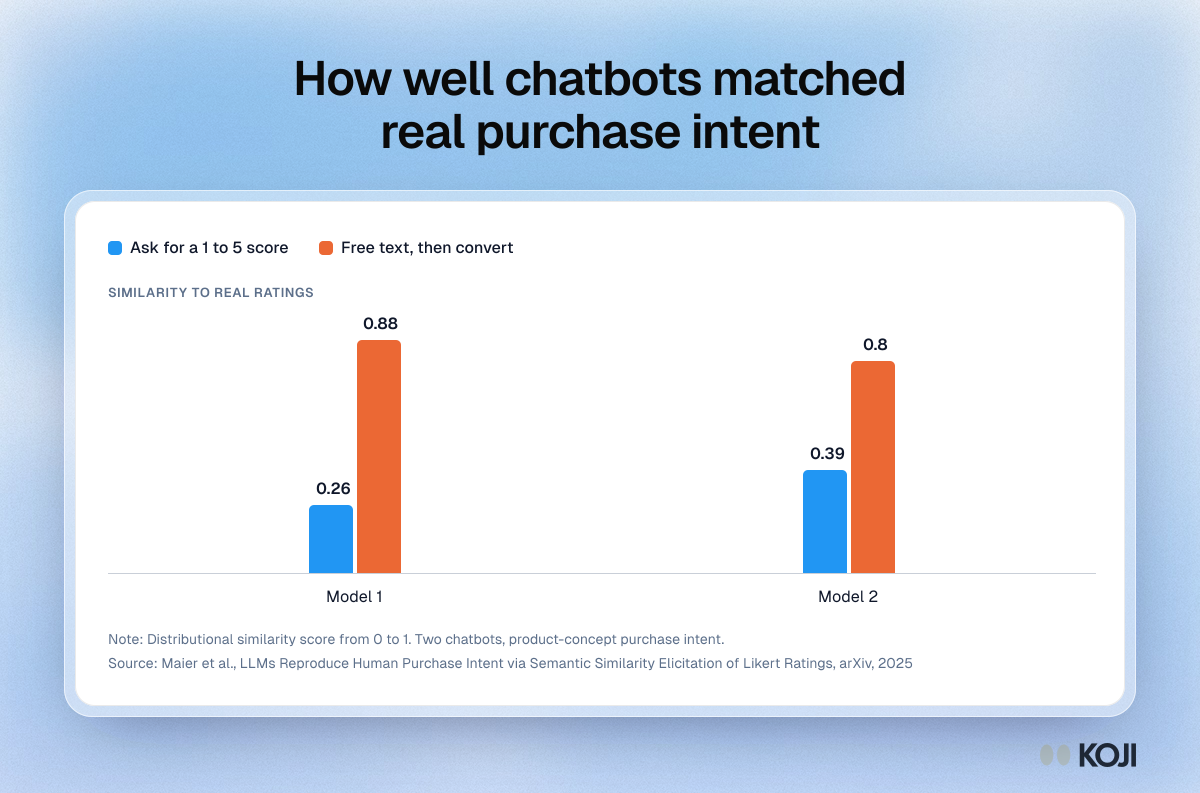
How well chatbots matched real purchase intent
Asking for a number gave a poor match. Asking for words first gave a close one.
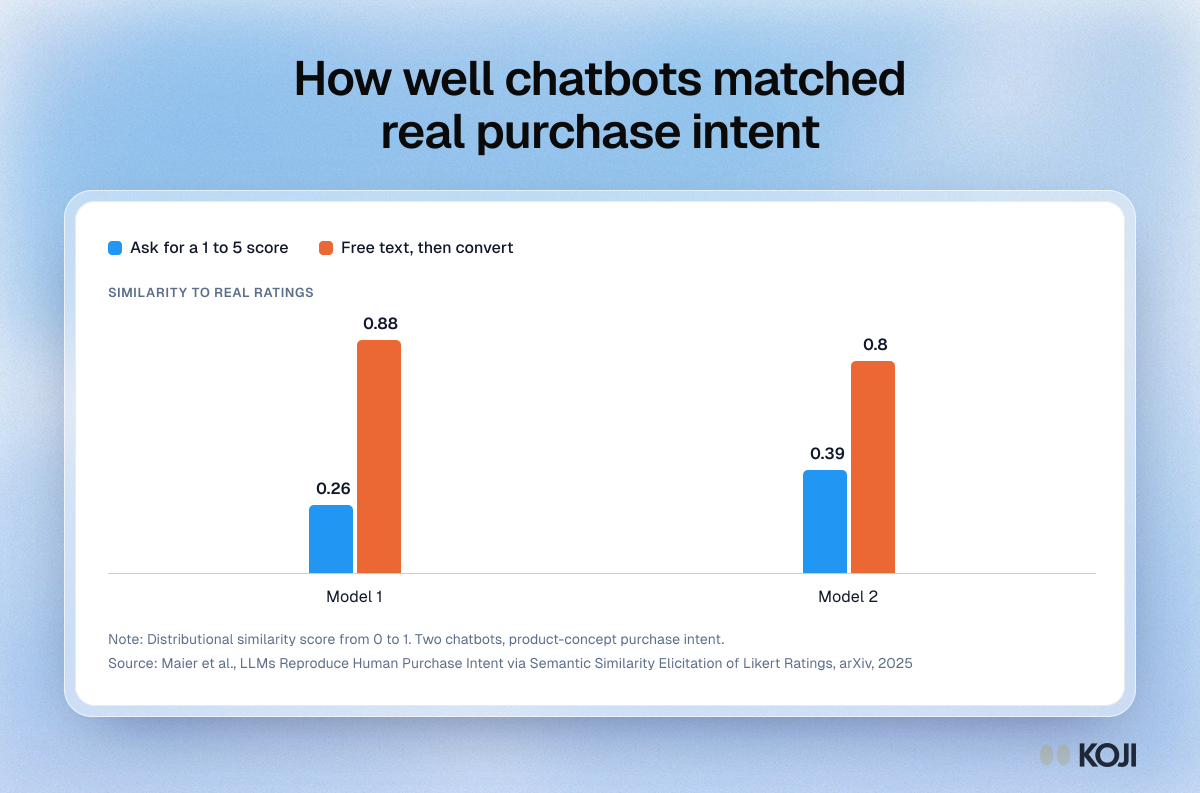
A 2025 preprint tested whether language models can stand in for survey respondents on purchase intent for product concepts. Asking directly for a 1 to 5 score matched real ratings poorly. Asking for a short opinion in words and converting it to a score matched far better. Useful for founders who are tempted to treat a chatbot answer as customer evidence: even the good result is about packaged consumer goods, not a new niche idea.
Where this appears
What's in this column chart
| Ask for a 1 to 5 score | Free text, then convert | |
|---|---|---|
| Model 1 | 0.26 | 0.88 |
| Model 2 | 0.39 | 0.8 |
Distributional similarity score from 0 to 1. Two chatbots, product-concept purchase intent.
Use this image
Free to use in your docs, decks and posts under CC BY 4.0, as long as you credit Koji with a link to this page. To embed it, paste this into your page:
<a href="https://www.koji.so/visuals/llm-purchase-intent-direct-rating-vs-semantic-similarity"><img src="https://www.koji.so/visuals/llm-purchase-intent-direct-rating-vs-semantic-similarity/llm-purchase-intent-direct-rating-vs-semantic-similarity.png" alt="Column chart: two chatbots matched real purchase-intent ratings at 0.26 and 0.39 when asked for a score, and 0.88 and 0.80 when asked for words first." width="1200" height="793" /></a>
<p>Source: <a href="https://www.koji.so/visuals/llm-purchase-intent-direct-rating-vs-semantic-similarity">How well chatbots matched real purchase intent</a>, Koji</p>