Column chart
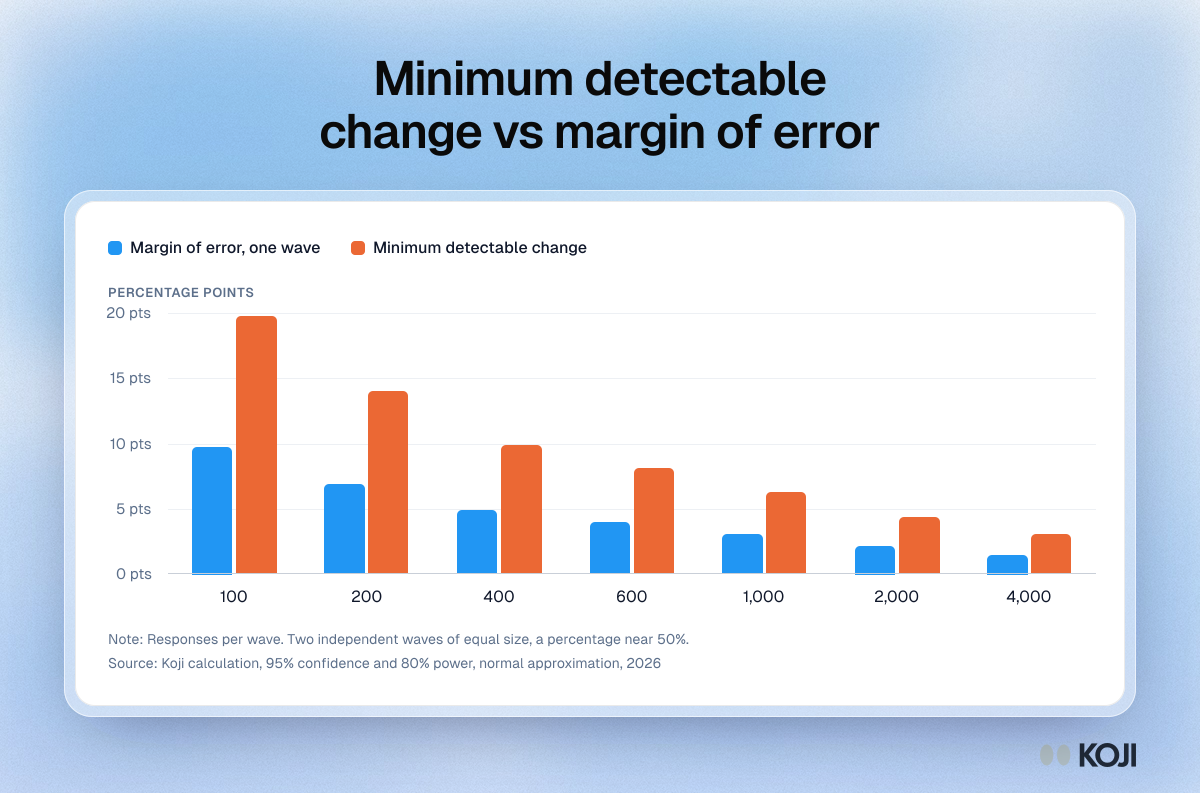
Minimum detectable change vs margin of error
Why a survey with a 5-point margin of error cannot see a 5-point move
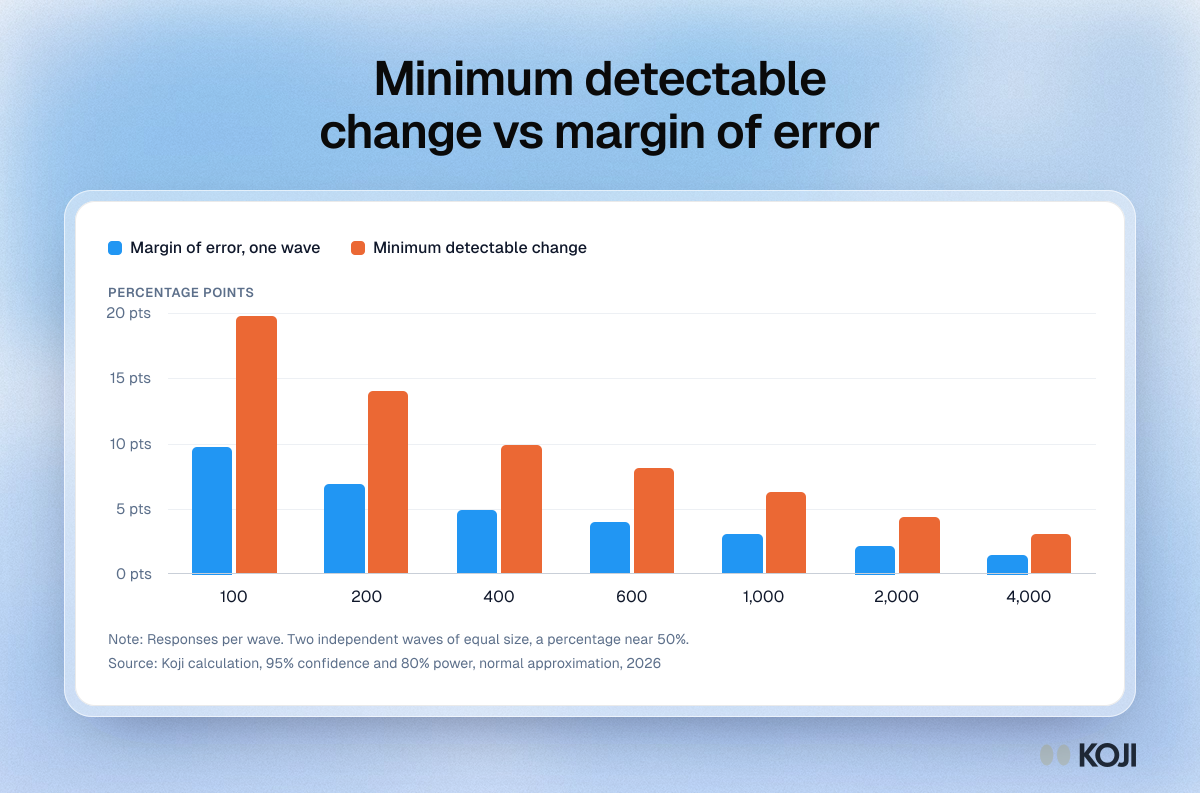
A chart of the minimum detectable change between two survey waves next to the margin of error for a single wave, from 100 to 4,000 responses per wave. It assumes a percentage near 50%, 95% confidence and 80% power. At every sample size the detectable change is about double the margin of error, so a 400-response tracker can see a 9.9-point move, not a 5-point one. Use it to size a tracker before fielding. Koji runs the structured questions and the follow-up why in the same interview.
Where this appears
What's in this column chart
| Margin of error, one wave | Minimum detectable change | |
|---|---|---|
| 100 | 9.8 pts | 19.8 pts |
| 200 | 6.9 pts | 14 pts |
| 400 | 4.9 pts | 9.9 pts |
| 600 | 4 pts | 8.1 pts |
| 1,000 | 3.1 pts | 6.3 pts |
| 2,000 | 2.2 pts | 4.4 pts |
| 4,000 | 1.5 pts | 3.1 pts |
Responses per wave. Two independent waves of equal size, a percentage near 50%.
Use this image
Free to use in your docs, decks and posts under CC BY 4.0, as long as you credit Koji with a link to this page. To embed it, paste this into your page:
<a href="https://www.koji.so/visuals/minimum-detectable-effect-vs-margin-of-error-by-sample-size"><img src="https://www.koji.so/visuals/minimum-detectable-effect-vs-margin-of-error-by-sample-size/minimum-detectable-effect-vs-margin-of-error-by-sample-size.png" alt="Column chart comparing margin of error with minimum detectable change by responses per wave: at 400 responses, 4.9 points against 9.9 points." width="1200" height="793" /></a>
<p>Source: <a href="https://www.koji.so/visuals/minimum-detectable-effect-vs-margin-of-error-by-sample-size">Minimum detectable change vs margin of error</a>, Koji</p>