Reference table
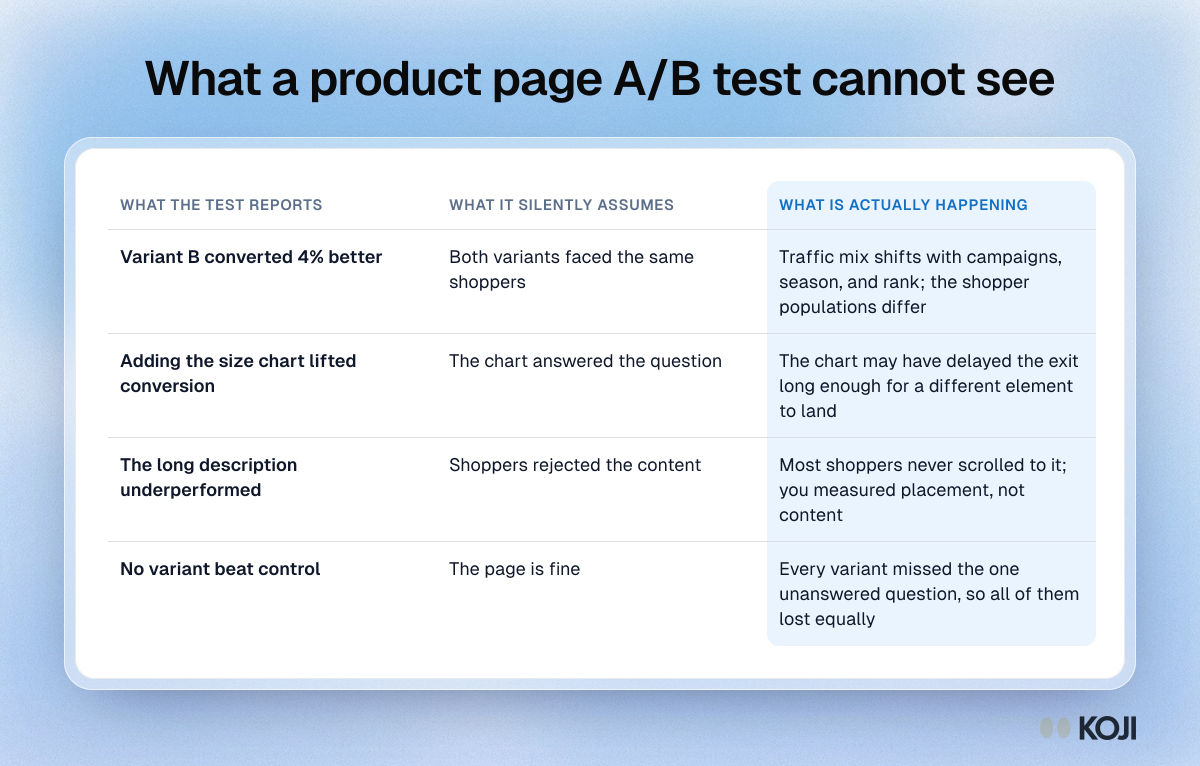
What a product page A/B test cannot see
Four test results, the assumption behind each, and what may really be going on
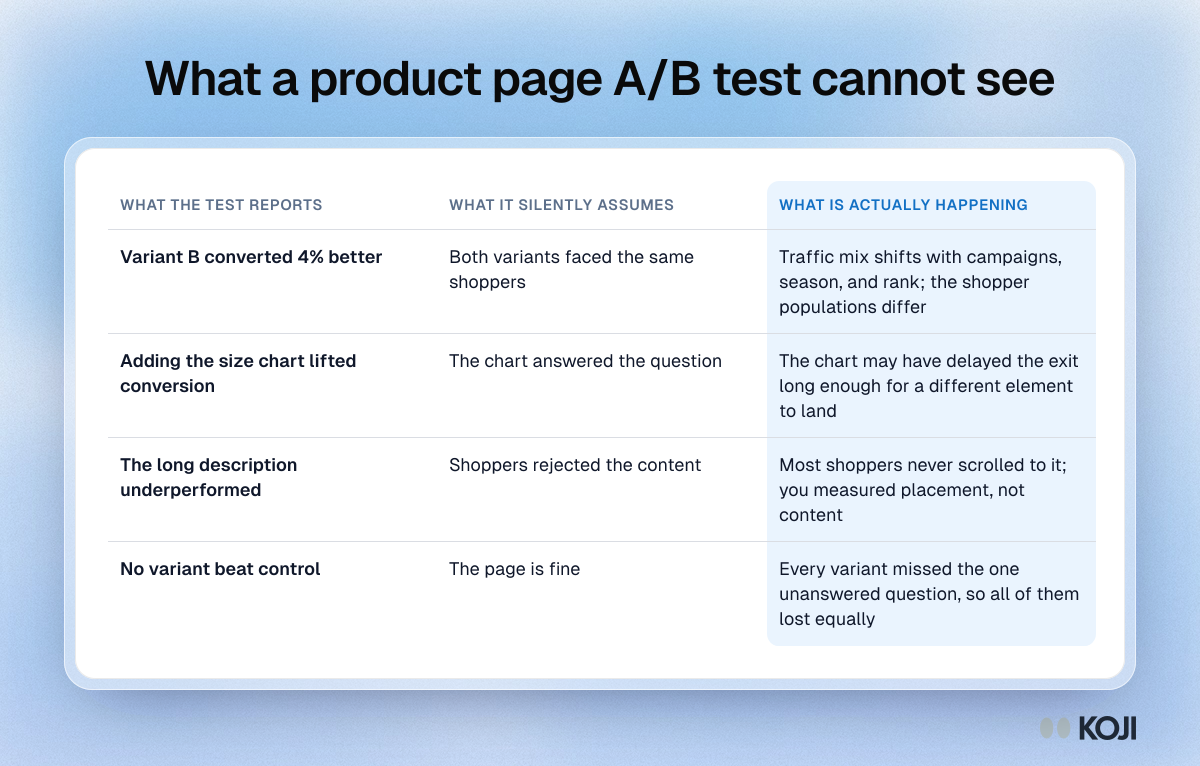
A table for ecommerce and CRO teams that read product detail page tests. It takes four common results, such as a variant converting 4% better or no variant beating control, and sets out the assumption hidden in each and what may actually be happening, from shifting traffic mix to shoppers never scrolling far enough. Use it before you report a PDP test as proof. Koji interviews non-buyers to find the question no variant answered.
Where this appears
What's in this reference table
| What the test reports | What it silently assumes | What is actually happening |
|---|---|---|
| Variant B converted 4% better | Both variants faced the same shoppers | Traffic mix shifts with campaigns, season, and rank; the shopper populations differ |
| Adding the size chart lifted conversion | The chart answered the question | The chart may have delayed the exit long enough for a different element to land |
| The long description underperformed | Shoppers rejected the content | Most shoppers never scrolled to it; you measured placement, not content |
| No variant beat control | The page is fine | Every variant missed the one unanswered question, so all of them lost equally |
Use this image
Free to use in your docs, decks and posts under CC BY 4.0, as long as you credit Koji with a link to this page. To embed it, paste this into your page:
html
<a href="https://www.koji.so/visuals/what-a-product-page-ab-test-cannot-see"><img src="https://www.koji.so/visuals/what-a-product-page-ab-test-cannot-see/what-a-product-page-ab-test-cannot-see.png" alt="Table of four product page test results, the assumption each one makes, and what may actually be happening, ending with a flat test where every variant failed." width="1200" height="766" /></a>
<p>Source: <a href="https://www.koji.so/visuals/what-a-product-page-ab-test-cannot-see">What a product page A/B test cannot see</a>, Koji</p>