Reference table
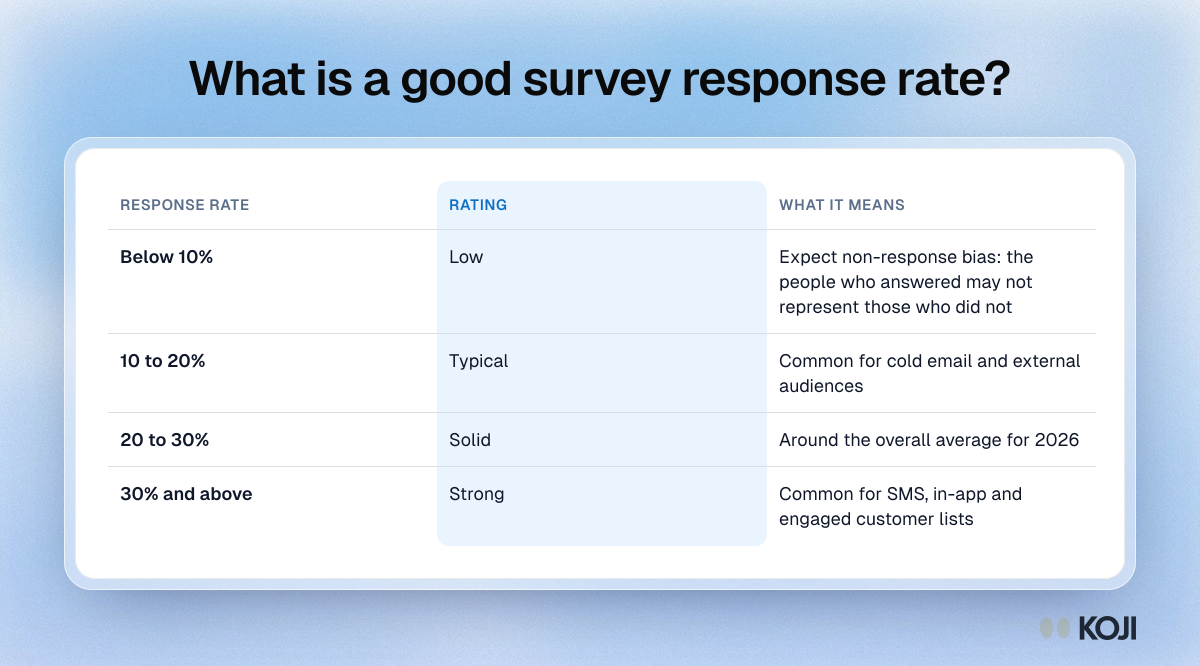
What is a good survey response rate?
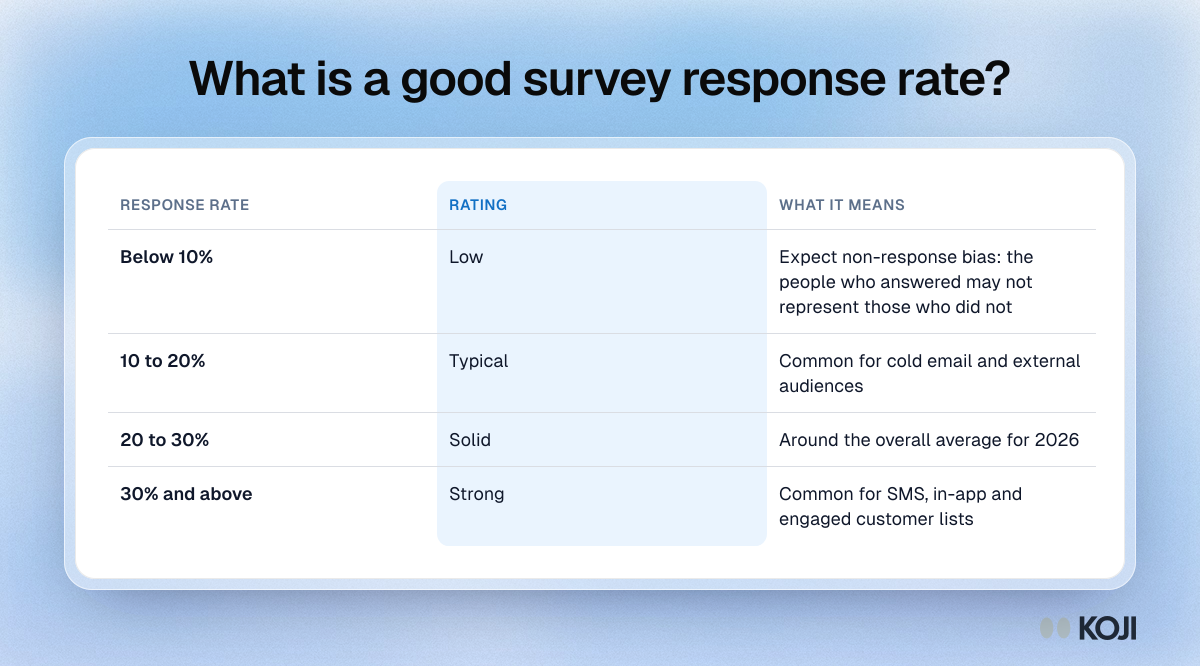
A quick reference table for reading a survey response rate, from below 10% (low, with a real risk of non-response bias) to 30% and above (strong). It is for researchers, CX and product teams who want to know whether their rate is good enough. Use it as a first check, then compare against the benchmark for your channel and confirm you have enough responses for your sample size.
Where this appears
What's in this reference table
| Response rate | Rating | What it means |
|---|---|---|
| Below 10% | Low | Expect non-response bias: the people who answered may not represent those who did not |
| 10 to 20% | Typical | Common for cold email and external audiences |
| 20 to 30% | Solid | Around the overall average for 2026 |
| 30% and above | Strong | Common for SMS, in-app and engaged customer lists |
Use this image
Free to use in your docs, decks and posts under CC BY 4.0, as long as you credit Koji with a link to this page. To embed it, paste this into your page:
html
<a href="https://www.koji.so/visuals/what-is-a-good-survey-response-rate-bands"><img src="https://www.koji.so/visuals/what-is-a-good-survey-response-rate-bands/what-is-a-good-survey-response-rate-bands.png" alt="Table rating survey response rates: below 10% is low, 10 to 20% typical, 20 to 30% solid and 30% or more strong, with what each band means." width="1200" height="666" /></a>
<p>Source: <a href="https://www.koji.so/visuals/what-is-a-good-survey-response-rate-bands">What is a good survey response rate?</a>, Koji</p>