Flowchart
Why are my survey answers thin?
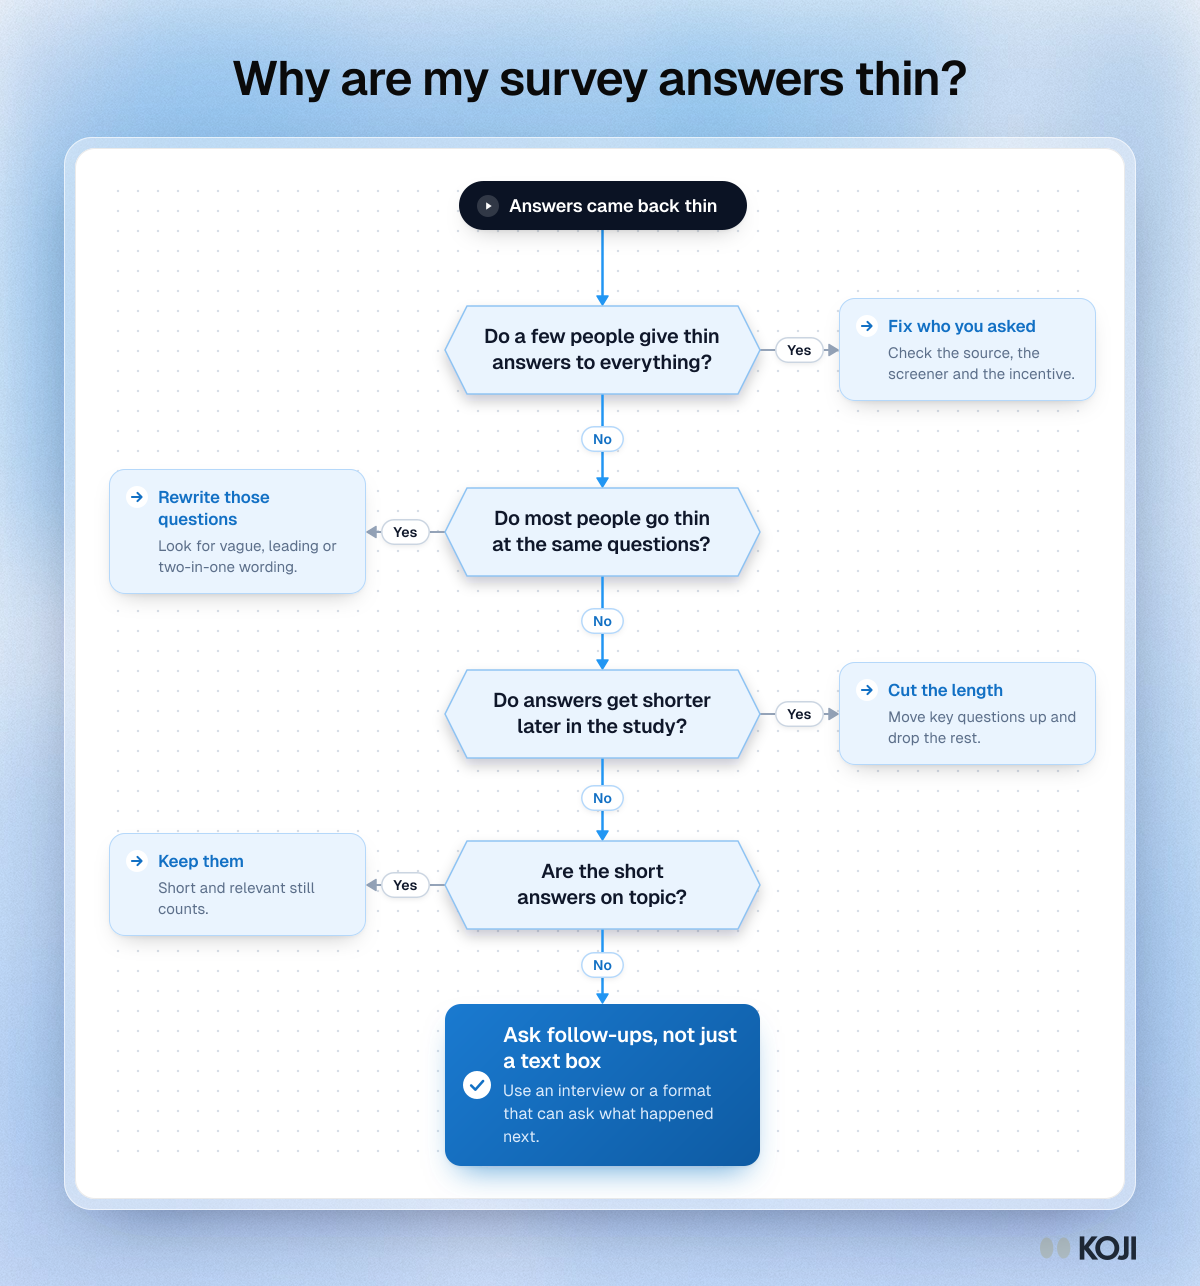
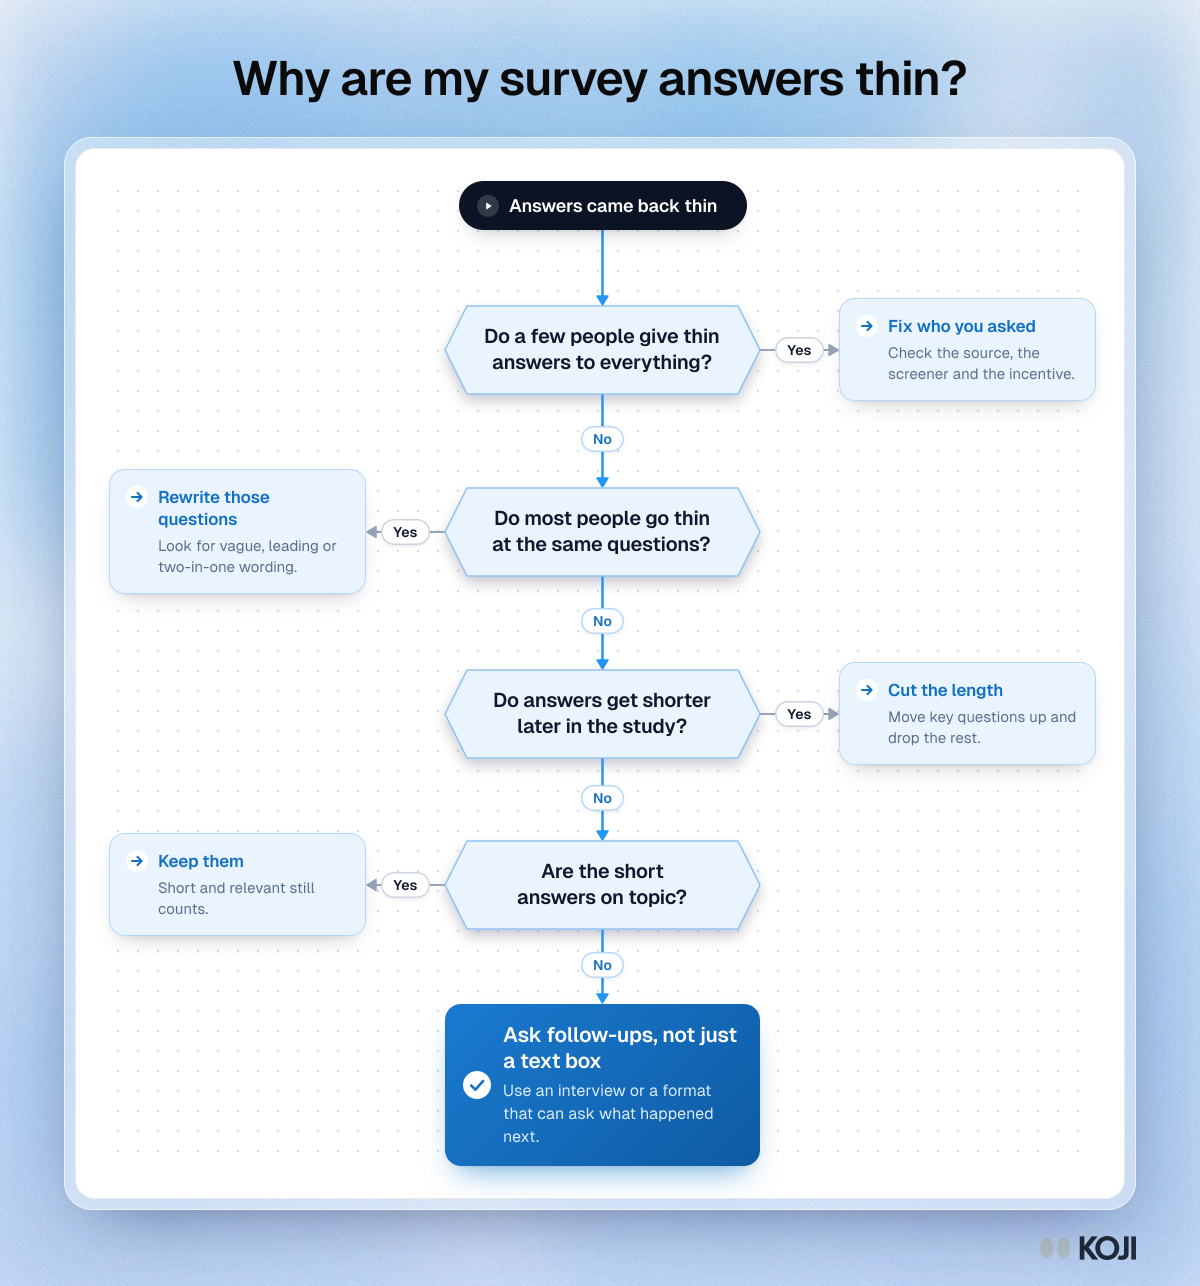
A decision flowchart for anyone whose survey or interview responses came back short or vague. It asks four questions about where the thin answers sit: in a few people, at the same questions, late in the study, or everywhere. Each answer points to one fix, such as changing the recruiting source, rewriting a question or cutting length. Koji helps with the last step by asking follow-up questions in AI-moderated interviews.
Where this appears
What's in this flowchart
Start: Answers came back thin
- Do a few people give thin answers to everything?
- No: go to 2.
- Yes: Fix who you asked. Check the source, the screener and the incentive.
- Do most people go thin at the same questions?
- No: go to 3.
- Yes: Rewrite those questions. Look for vague, leading or two-in-one wording.
- Do answers get shorter later in the study?
- No: go to 4.
- Yes: Cut the length. Move key questions up and drop the rest.
- Are the short answers on topic?
- No: go to 5.
- Yes: Keep them. Short and relevant still counts.
- Finish: Ask follow-ups, not just a text box. Use an interview or a format that can ask what happened next.
Use this image
Free to use in your docs, decks and posts under CC BY 4.0, as long as you credit Koji with a link to this page. To embed it, paste this into your page:
html
<a href="https://www.koji.so/visuals/why-survey-answers-are-thin-flowchart"><img src="https://www.koji.so/visuals/why-survey-answers-are-thin-flowchart/why-survey-answers-are-thin-flowchart.png" alt="Flowchart for diagnosing thin survey answers: four yes or no questions on who, which questions, how late and relevance, ending in follow-ups." width="1200" height="1286" /></a>
<p>Source: <a href="https://www.koji.so/visuals/why-survey-answers-are-thin-flowchart">Why are my survey answers thin?</a>, Koji</p>