Flowchart
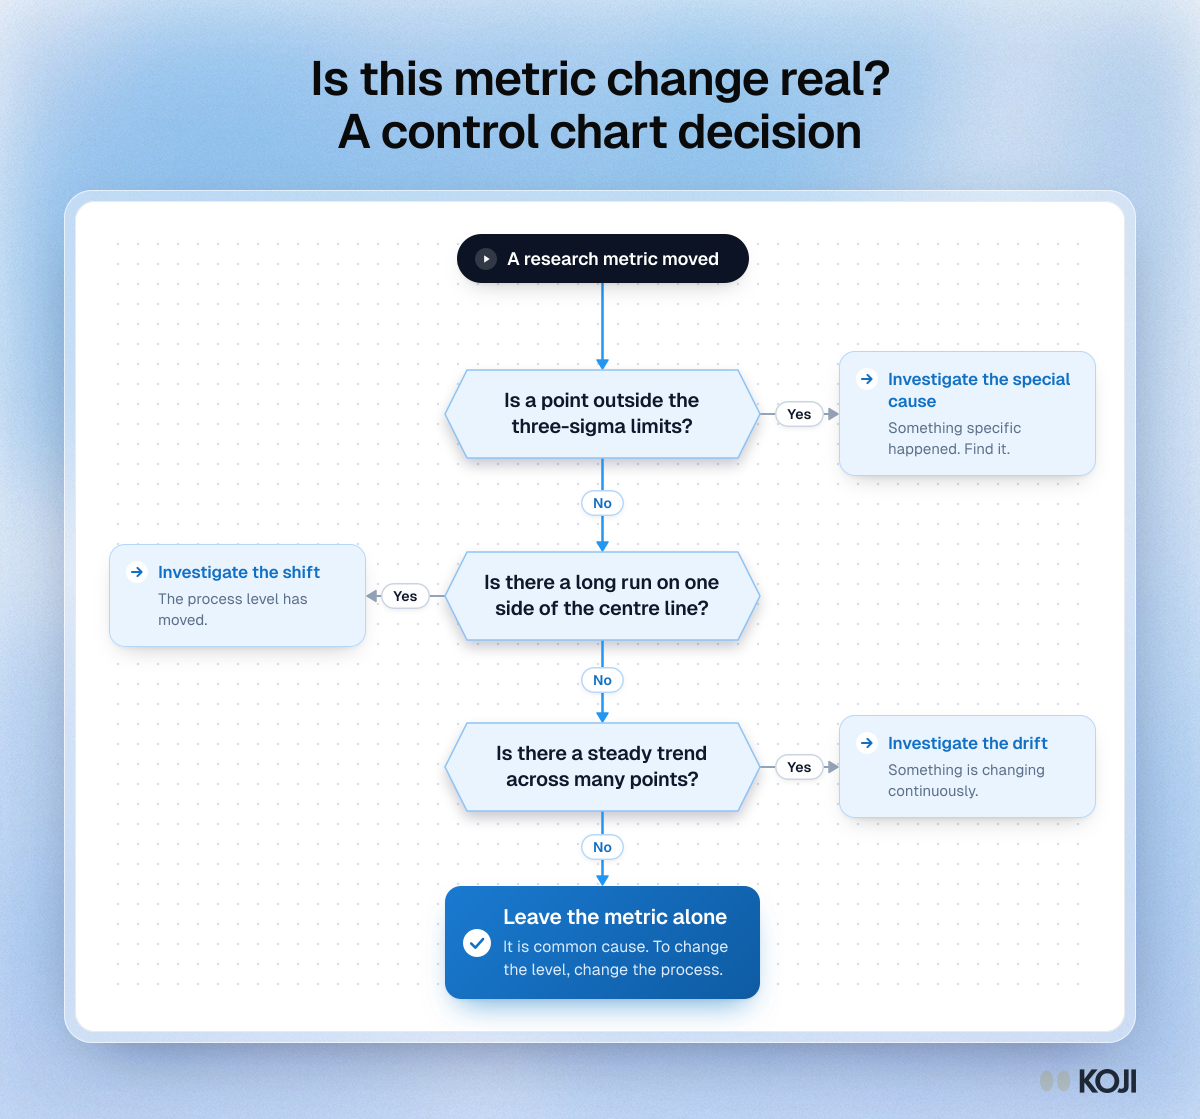
Is this metric change real? A control chart decision
The decision rule to agree before the number moves
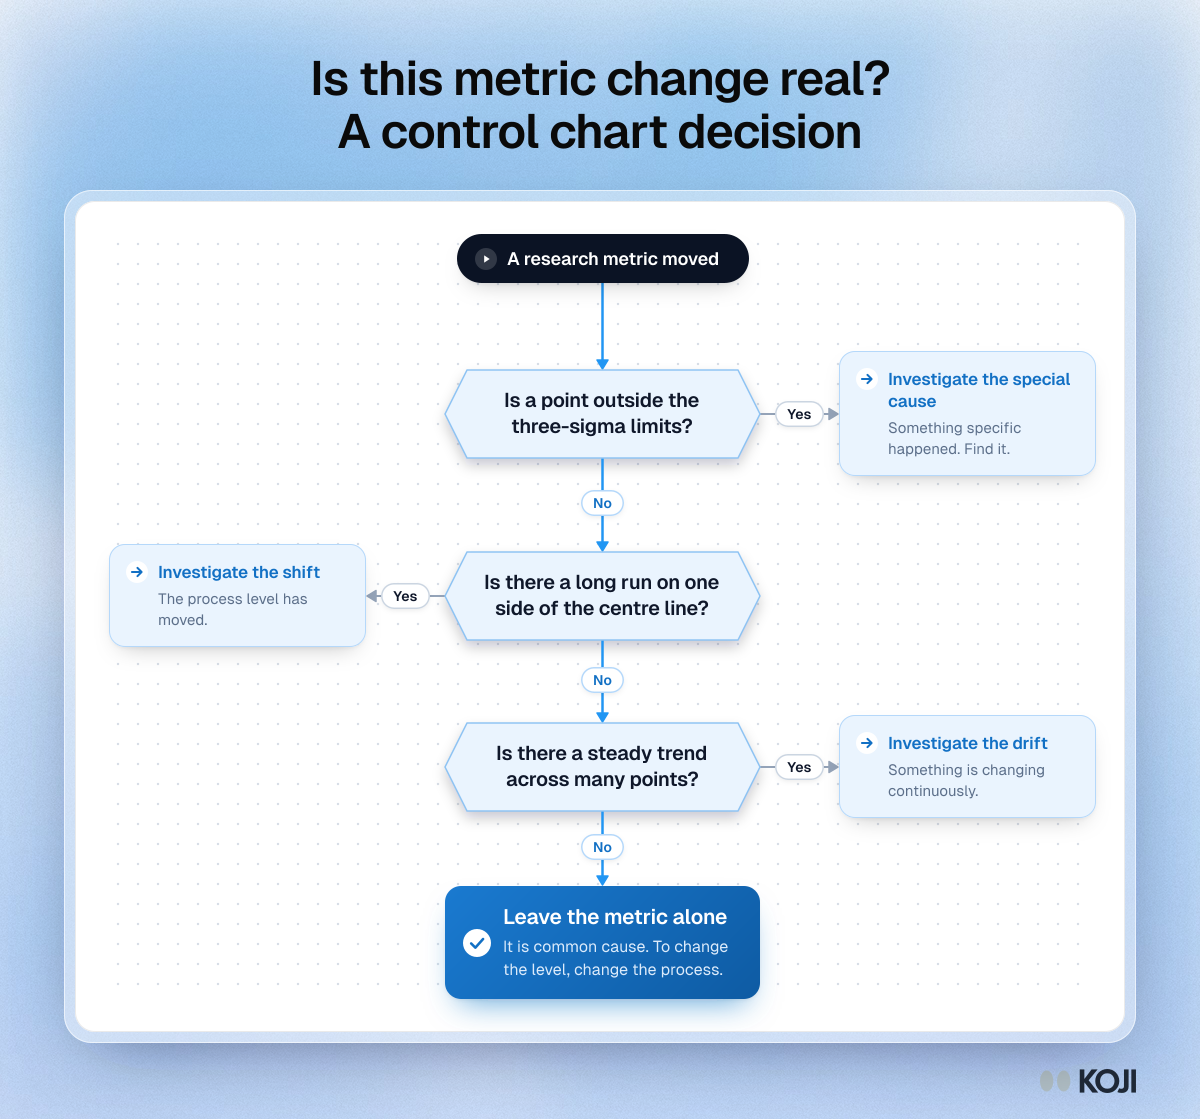
A decision flowchart for reading a process behaviour chart on a research metric such as NPS, satisfaction or completion rate. It asks whether a point sits outside the three-sigma limits, whether there is a long run on one side of the centre line and whether there is a steady trend. Any yes is a special cause worth investigating. Three noes mean common cause variation, and the right move is to leave the metric alone.
Where this appears
What's in this flowchart
Start: A research metric moved
- Is a point outside the three-sigma limits?
- No: go to 2.
- Yes: Investigate the special cause. Something specific happened. Find it.
- Is there a long run on one side of the centre line?
- No: go to 3.
- Yes: Investigate the shift. The process level has moved.
- Is there a steady trend across many points?
- No: go to 4.
- Yes: Investigate the drift. Something is changing continuously.
- Finish: Leave the metric alone. It is common cause. To change the level, change the process.
Use this image
Free to use in your docs, decks and posts under CC BY 4.0, as long as you credit Koji with a link to this page. To embed it, paste this into your page:
html
<a href="https://www.koji.so/visuals/is-this-metric-change-real-control-chart-flowchart"><img src="https://www.koji.so/visuals/is-this-metric-change-real-control-chart-flowchart/is-this-metric-change-real-control-chart-flowchart.png" alt="Flowchart for a metric that moved: three questions about limits, runs and trends, each leading to an investigation, ending in leaving the metric alone." width="1200" height="1119" /></a>
<p>Source: <a href="https://www.koji.so/visuals/is-this-metric-change-real-control-chart-flowchart">Is this metric change real? A control chart decision</a>, Koji</p>