Process
How to build a control chart for a research metric
An individuals chart in seven steps
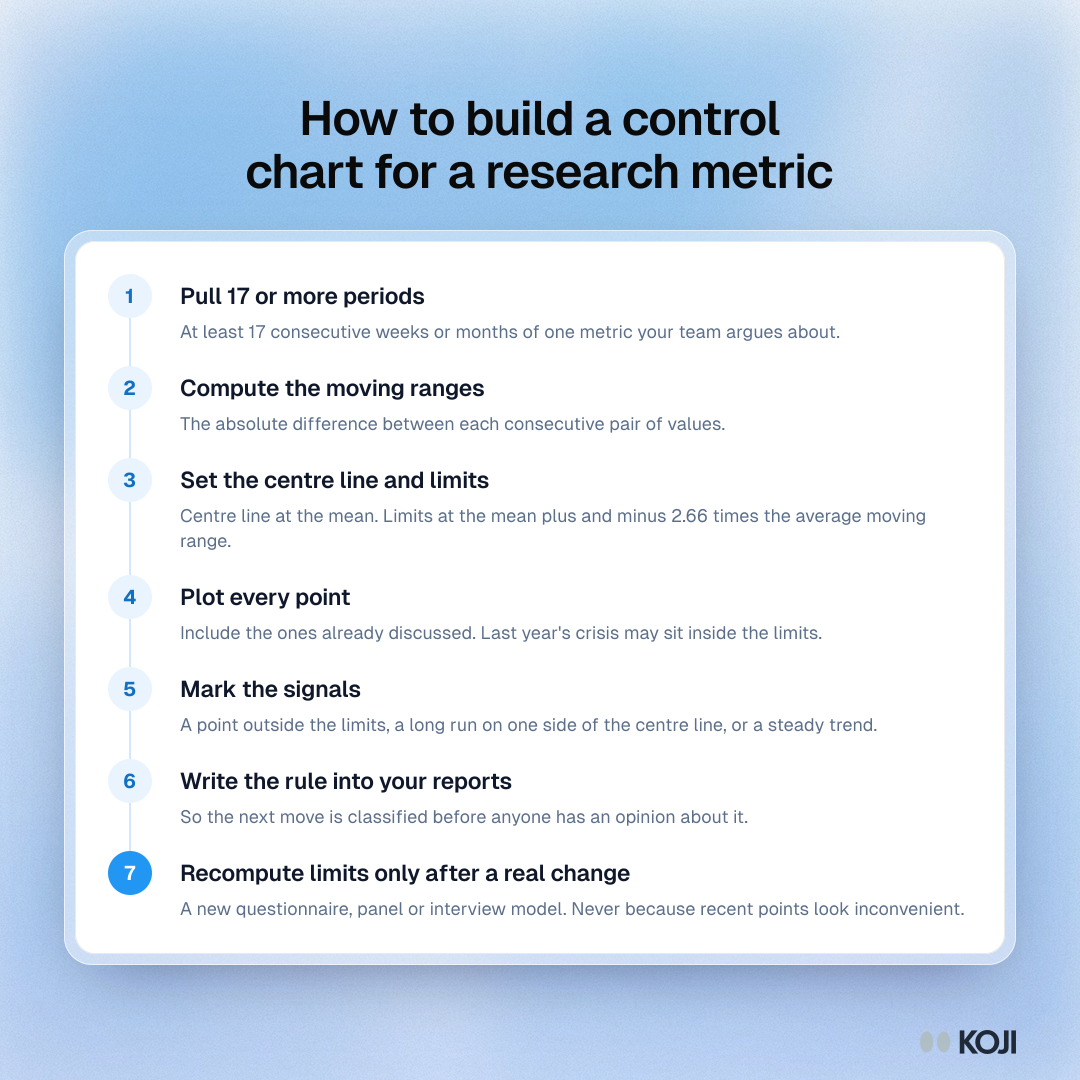
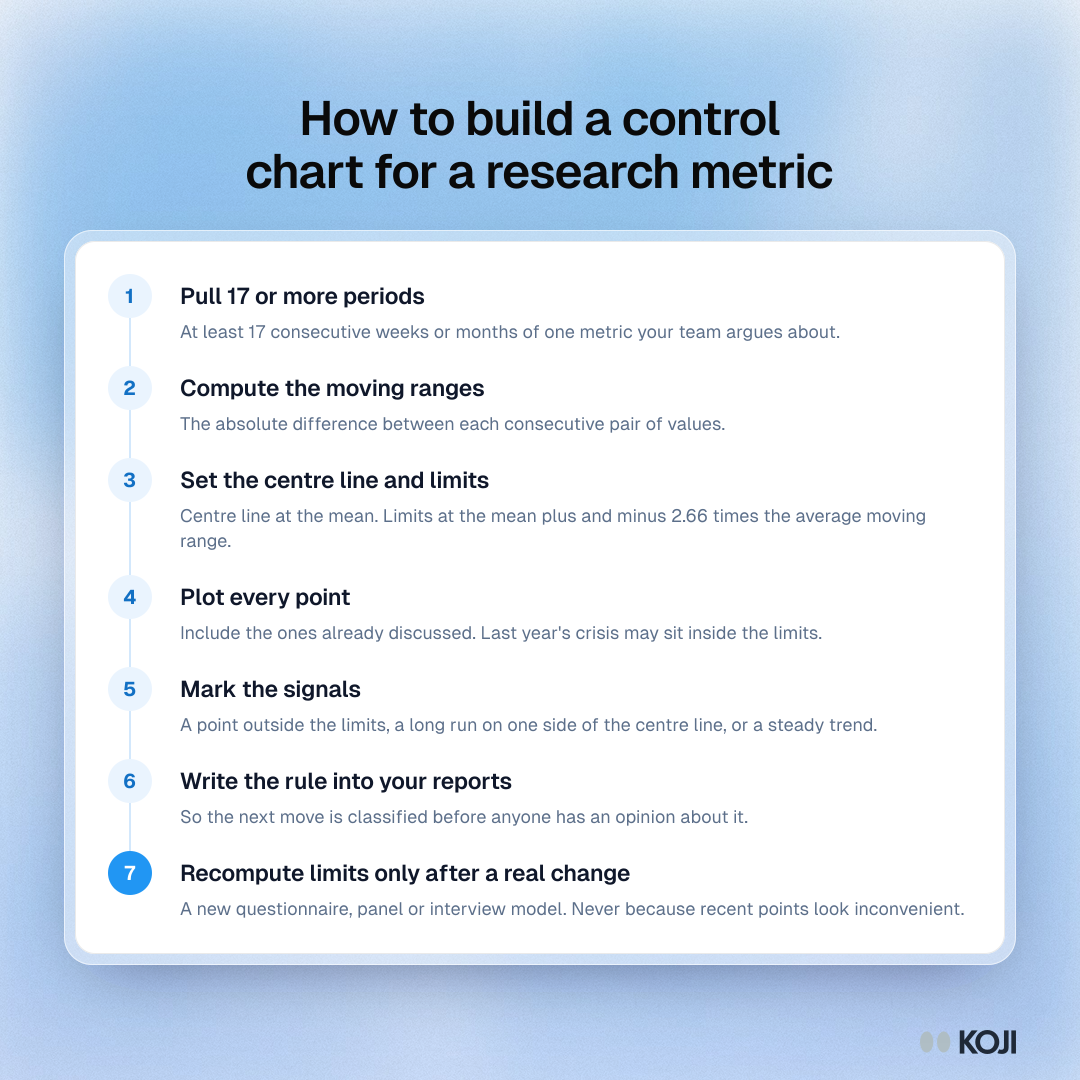
Seven steps for building an individuals control chart, also called a process behaviour chart, on a weekly or monthly research metric. Pull at least 17 periods, compute moving ranges, set limits at the mean plus and minus 2.66 times the average moving range, plot every point, mark the signals, write the rule into reporting and recompute limits only after a real process change. Koji keeps question IDs stable across waves, so the series stays comparable.
Where this appears
What's in this process
- Pull 17 or more periods: At least 17 consecutive weeks or months of one metric your team argues about.
- Compute the moving ranges: The absolute difference between each consecutive pair of values.
- Set the centre line and limits: Centre line at the mean. Limits at the mean plus and minus 2.66 times the average moving range.
- Plot every point: Include the ones already discussed. Last year's crisis may sit inside the limits.
- Mark the signals: A point outside the limits, a long run on one side of the centre line, or a steady trend.
- Write the rule into your reports: So the next move is classified before anyone has an opinion about it.
- Recompute limits only after a real change: A new questionnaire, panel or interview model. Never because recent points look inconvenient.
Use this image
Free to use in your docs, decks and posts under CC BY 4.0, as long as you credit Koji with a link to this page. To embed it, paste this into your page:
html
<a href="https://www.koji.so/visuals/how-to-build-individuals-control-chart-steps"><img src="https://www.koji.so/visuals/how-to-build-individuals-control-chart-steps/how-to-build-individuals-control-chart-steps.png" alt="Process with seven steps for building an individuals control chart: pull 17 periods, compute moving ranges, set limits at 2.66 times, plot, mark signals." width="1080" height="1080" /></a>
<p>Source: <a href="https://www.koji.so/visuals/how-to-build-individuals-control-chart-steps">How to build a control chart for a research metric</a>, Koji</p>