Bar chart
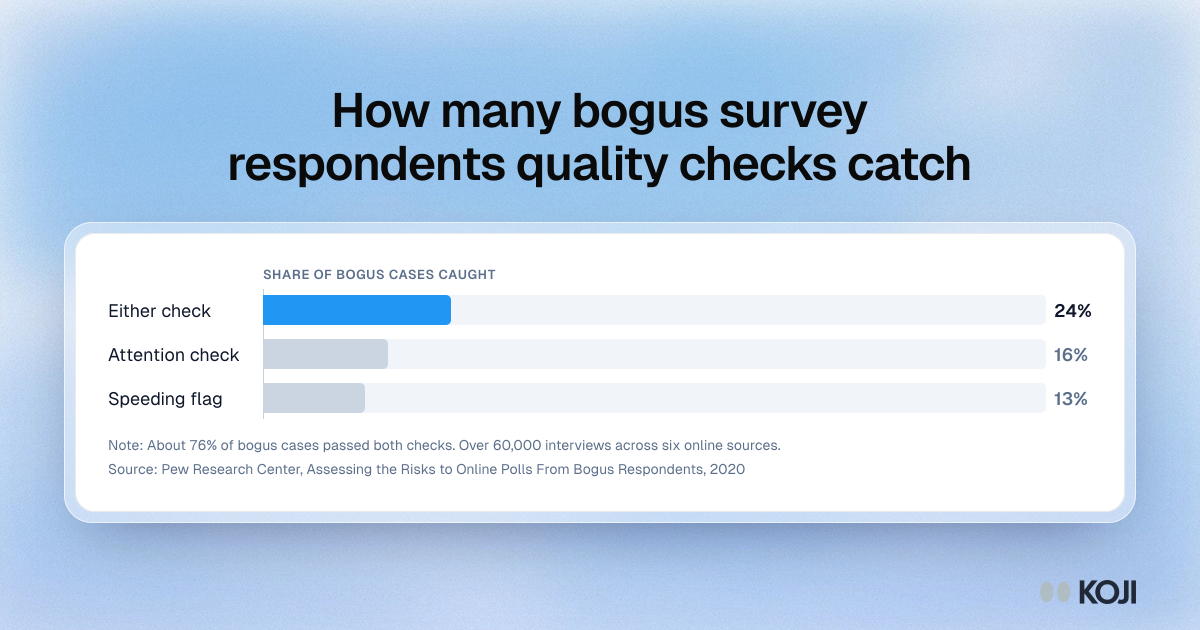
How many bogus survey respondents quality checks catch
Attention checks and speeding flags tested against known bogus cases in online polls
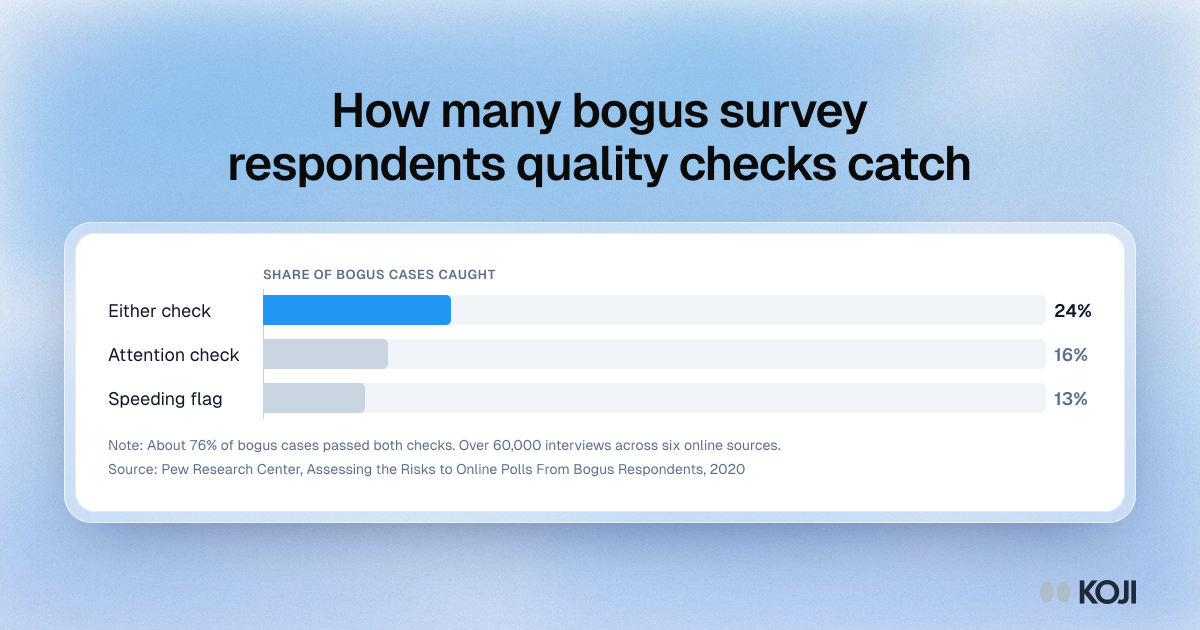
A bar chart from Pew Research Center's 2020 study of bogus respondents in online polls, which measured how many known bogus cases two common checks catch. An attention check flagged 16%, a speeding flag 13%, and the two together 24%, leaving about three quarters undetected. Use it before adding more checks to a screener as the fix for bad participants. In a Koji interview, the AI follows up on vague answers, the step where invented experiences tend to show.
Where this appears
What's in this bar chart
| Bogus cases caught | |
|---|---|
| Either check | 24% |
| Attention check | 16% |
| Speeding flag | 13% |
About 76% of bogus cases passed both checks. Over 60,000 interviews across six online sources.
Use this image
Free to use in your docs, decks and posts under CC BY 4.0, as long as you credit Koji with a link to this page. To embed it, paste this into your page:
<a href="https://www.koji.so/visuals/attention-check-speeder-flag-bogus-respondents-caught"><img src="https://www.koji.so/visuals/attention-check-speeder-flag-bogus-respondents-caught/attention-check-speeder-flag-bogus-respondents-caught.png" alt="Bar chart of bogus survey respondents caught by quality checks: 16% by an attention check, 13% by a speeding flag and 24% by either one." width="1200" height="630" /></a>
<p>Source: <a href="https://www.koji.so/visuals/attention-check-speeder-flag-bogus-respondents-caught">How many bogus survey respondents quality checks catch</a>, Koji</p>