Bar chart
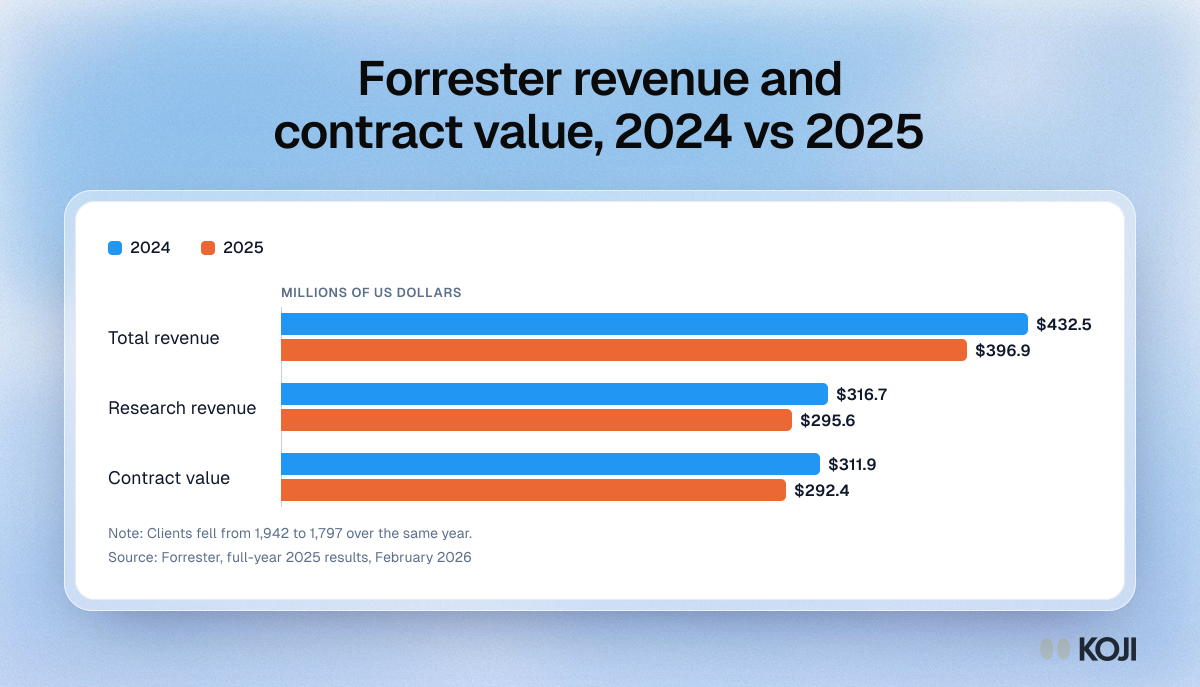
Forrester revenue and contract value, 2024 vs 2025
Full-year results from one of the two major analyst firms
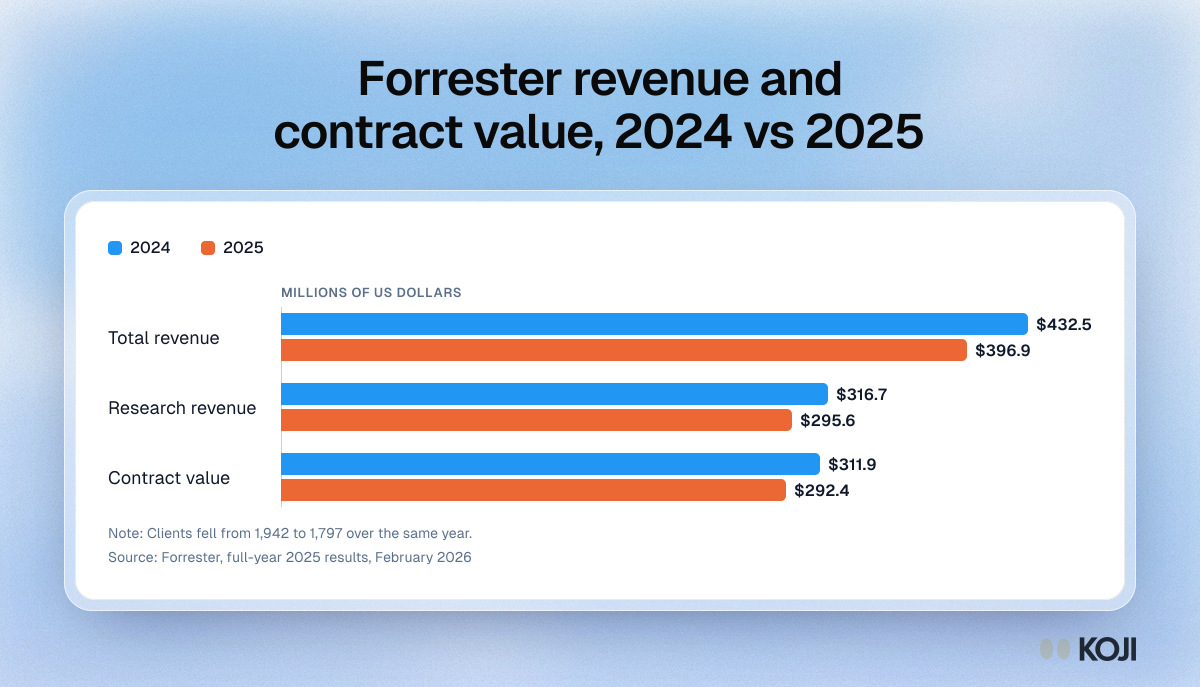
A grouped bar chart of Forrester's full-year 2024 and 2025 results: total revenue, research revenue and contract value all fell, and the client count dropped from 1,942 to 1,797. It sits in a piece about what analyst reports can and cannot tell a B2B buyer. Use it as context when deciding how much of a vendor evaluation to base on syndicated research. The questions only your own buyers can answer are what Koji interviews are built for.
Where this appears
What's in this bar chart
| 2024 | 2025 | |
|---|---|---|
| Total revenue | $432.5 | $396.9 |
| Research revenue | $316.7 | $295.6 |
| Contract value | $311.9 | $292.4 |
Clients fell from 1,942 to 1,797 over the same year.
Use this image
Free to use in your docs, decks and posts under CC BY 4.0, as long as you credit Koji with a link to this page. To embed it, paste this into your page:
html
<a href="https://www.koji.so/visuals/forrester-revenue-and-contract-value-2024-vs-2025"><img src="https://www.koji.so/visuals/forrester-revenue-and-contract-value-2024-vs-2025/forrester-revenue-and-contract-value-2024-vs-2025.png" alt="Bar chart of Forrester results in millions of dollars: revenue fell from 432.5 to 396.9, research revenue 316.7 to 295.6, contract value 311.9 to 292.4." width="1200" height="687" /></a>
<p>Source: <a href="https://www.koji.so/visuals/forrester-revenue-and-contract-value-2024-vs-2025">Forrester revenue and contract value, 2024 vs 2025</a>, Koji</p>