Bar chart
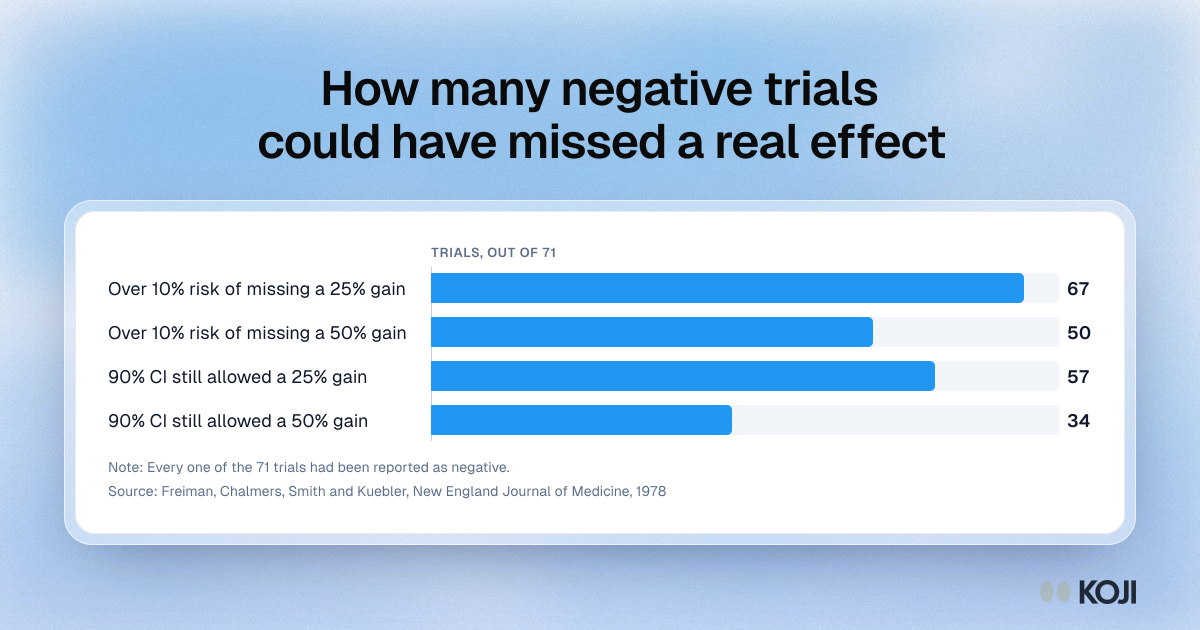
How many negative trials could have missed a real effect
Freiman and colleagues re-examined 71 randomised trials reported as showing no difference
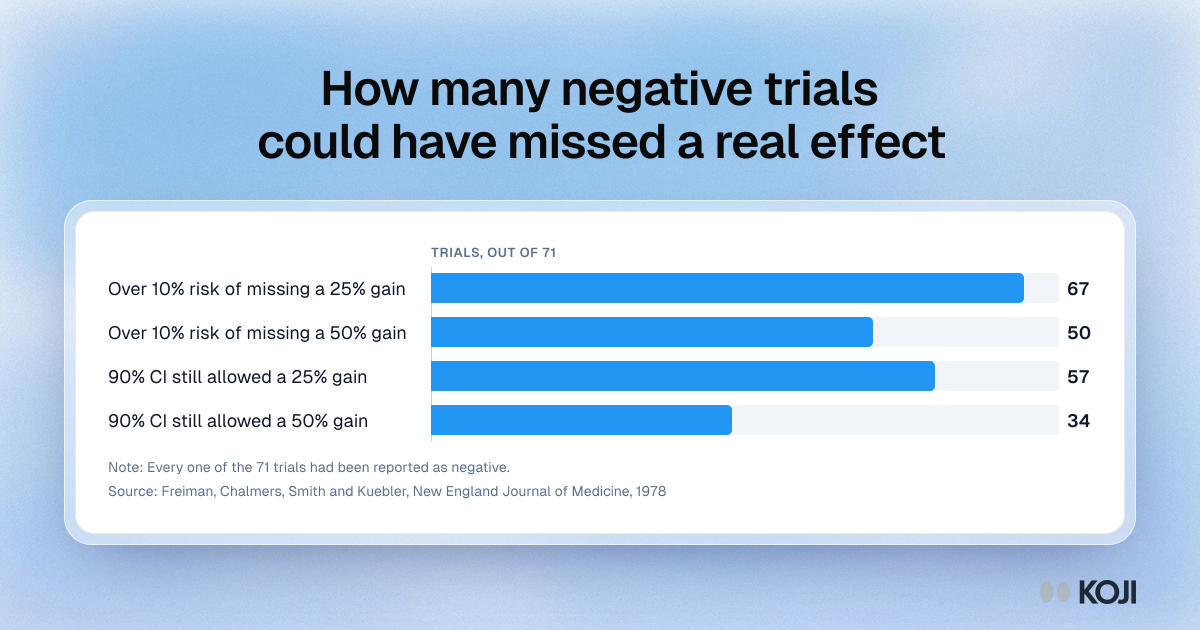
A bar chart of Freiman, Chalmers, Smith and Kuebler's 1978 re-analysis of 71 randomised trials that had been reported as negative. 67 of them had more than a 10 percent risk of missing a real 25 percent improvement, and in 34 the 90 percent confidence interval still allowed the treatment to be 50 percent better. Use it to explain why a non-significant result cannot justify a no-difference decision. Equivalence testing needs larger samples, which AI-moderated studies in Koji make cheaper to collect.
Where this appears
What's in this bar chart
| Trials | |
|---|---|
| Over 10% risk of missing a 25% gain | 67 |
| Over 10% risk of missing a 50% gain | 50 |
| 90% CI still allowed a 25% gain | 57 |
| 90% CI still allowed a 50% gain | 34 |
Every one of the 71 trials had been reported as negative.
Use this image
Free to use in your docs, decks and posts under CC BY 4.0, as long as you credit Koji with a link to this page. To embed it, paste this into your page:
<a href="https://www.koji.so/visuals/negative-trials-underpowered-freiman-1978"><img src="https://www.koji.so/visuals/negative-trials-underpowered-freiman-1978/negative-trials-underpowered-freiman-1978.png" alt="Bar chart of 71 trials reported as negative: 67 risked missing a 25% improvement, and in 34 the data still allowed a 50% improvement." width="1200" height="630" /></a>
<p>Source: <a href="https://www.koji.so/visuals/negative-trials-underpowered-freiman-1978">How many negative trials could have missed a real effect</a>, Koji</p>