Key figure
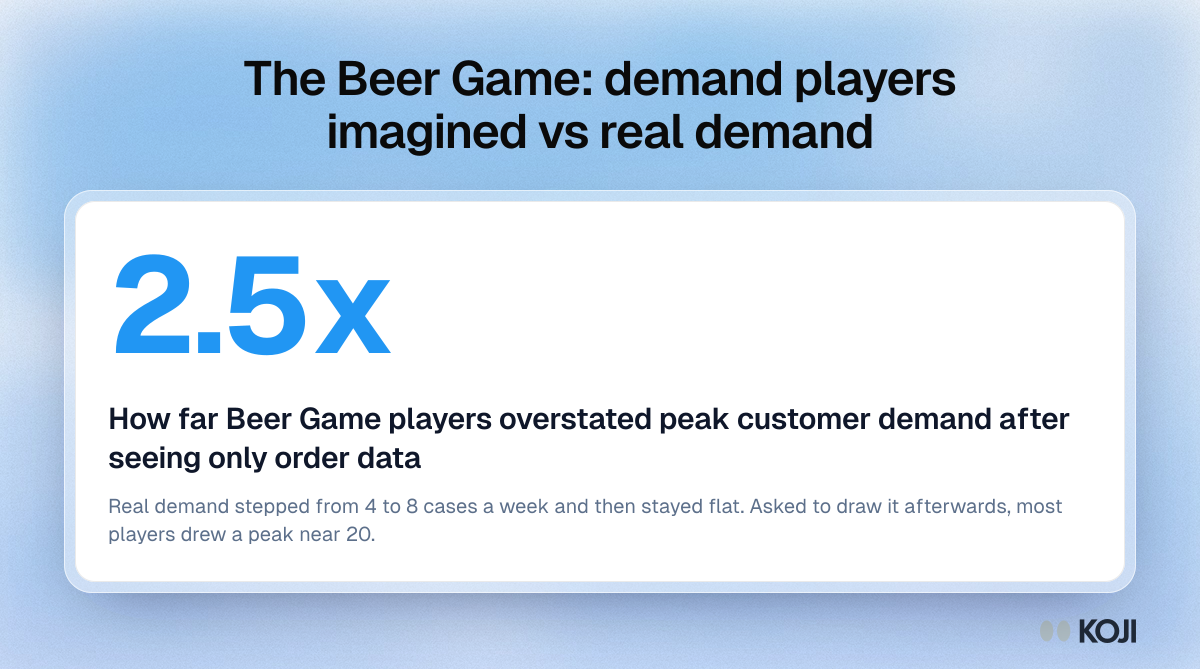
The Beer Game: demand players imagined vs real demand
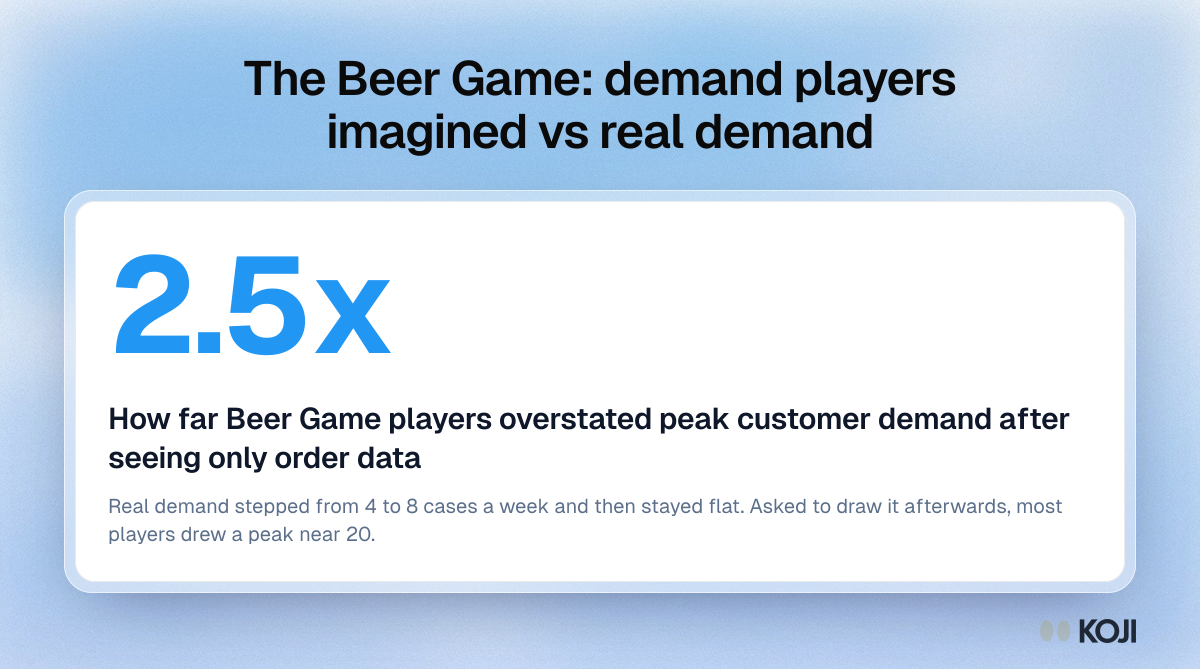
A stat from the Beer Game, the supply chain simulation run at MIT since the 1960s and described by John Sterman. Customer demand steps once from 4 to 8 cases a week and stays flat, yet players who see only the orders from the next tier draw a peak near 20 cases, a 2.5x overstatement. It is a quick way to show why channel order data should not stand in for customer demand. To hear what end customers actually want, ask them directly, for example through AI-moderated interviews in Koji.
Where this appears
What's in this key figure
2.5x How far Beer Game players overstated peak customer demand after seeing only order dataReal demand stepped from 4 to 8 cases a week and then stayed flat. Asked to draw it afterwards, most players drew a peak near 20.
Use this image
Free to use in your docs, decks and posts under CC BY 4.0, as long as you credit Koji with a link to this page. To embed it, paste this into your page:
<a href="https://www.koji.so/visuals/beer-game-perceived-vs-actual-customer-demand"><img src="https://www.koji.so/visuals/beer-game-perceived-vs-actual-customer-demand/beer-game-perceived-vs-actual-customer-demand.png" alt="Stat card: Beer Game players overstated peak customer demand 2.5 times, drawing a peak near 20 cases when real demand was a flat 8." width="1200" height="669" /></a>
<p>Source: <a href="https://www.koji.so/visuals/beer-game-perceived-vs-actual-customer-demand">The Beer Game: demand players imagined vs real demand</a>, Koji</p>