Reference table
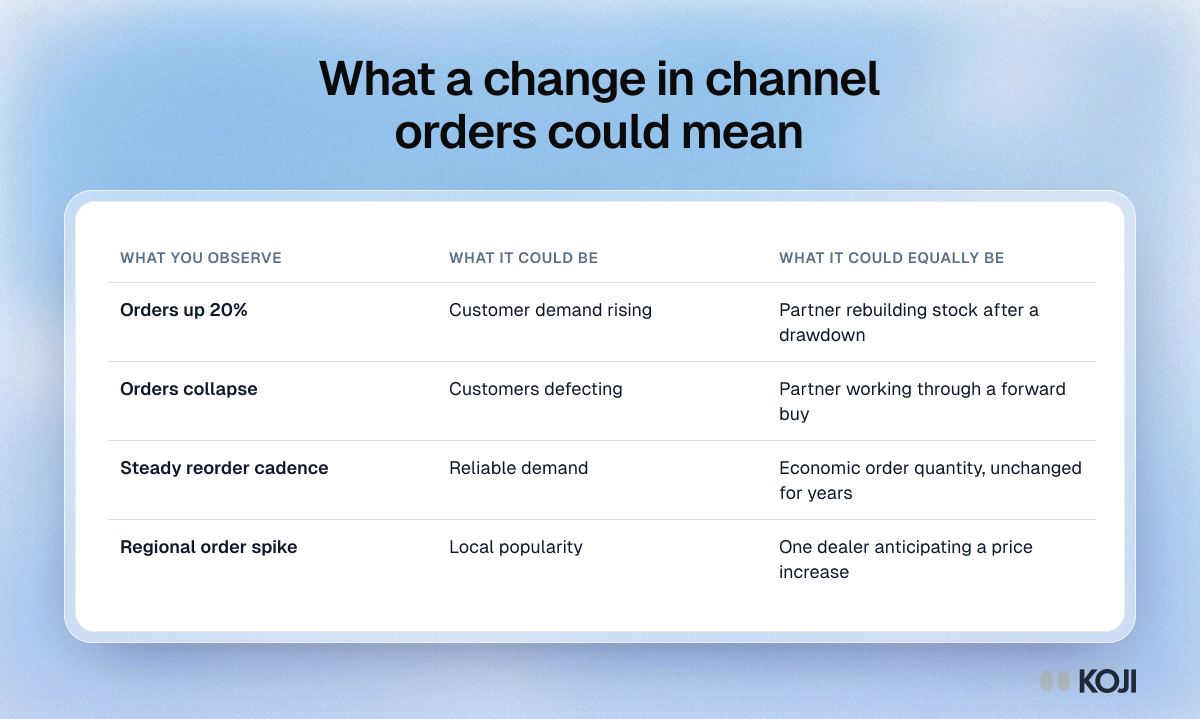
What a change in channel orders could mean
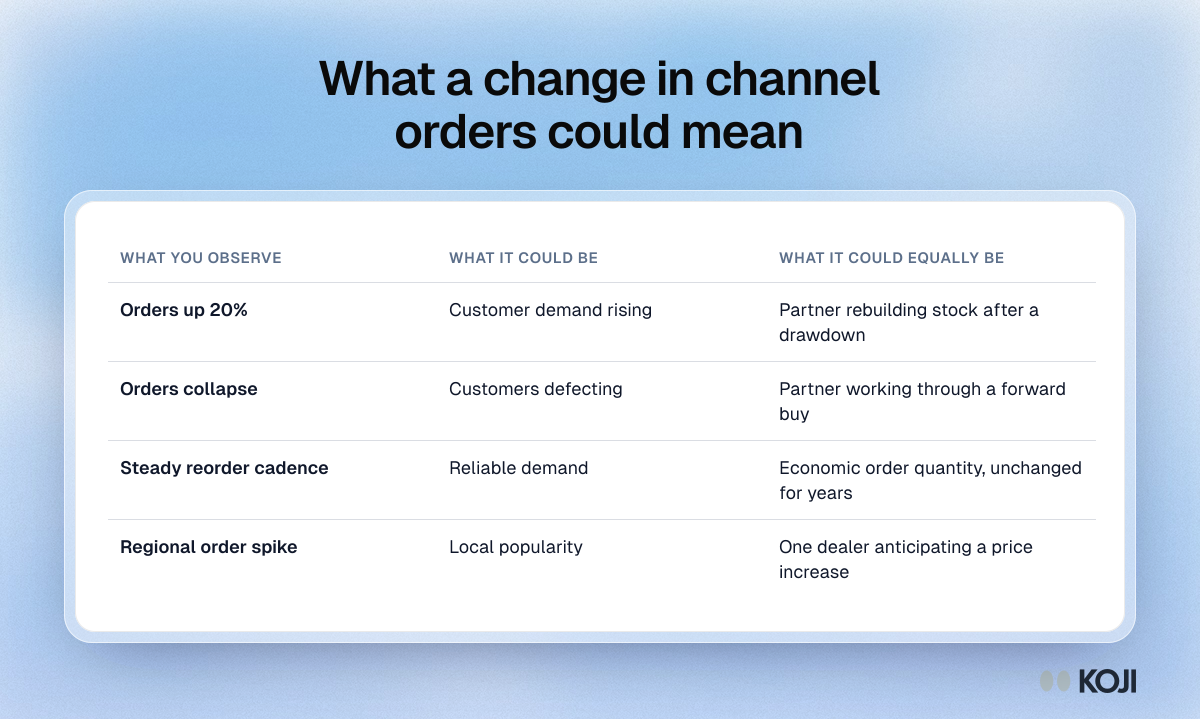
A table of four common readings of channel order data and the equally plausible explanation behind each: rising orders that may be restocking, a collapse that may be a forward buy working through, a steady cadence that may be a fixed order quantity, and a regional spike that may be one dealer buying ahead of a price rise. Use it before you present order trends as customer demand. The way to tell them apart is to ask end customers, which Koji does at scale with AI-moderated interviews.
Where this appears
What's in this reference table
| What you observe | What it could be | What it could equally be |
|---|---|---|
| Orders up 20% | Customer demand rising | Partner rebuilding stock after a drawdown |
| Orders collapse | Customers defecting | Partner working through a forward buy |
| Steady reorder cadence | Reliable demand | Economic order quantity, unchanged for years |
| Regional order spike | Local popularity | One dealer anticipating a price increase |
Use this image
Free to use in your docs, decks and posts under CC BY 4.0, as long as you credit Koji with a link to this page. To embed it, paste this into your page:
html
<a href="https://www.koji.so/visuals/channel-order-signals-ambiguous-readings-table"><img src="https://www.koji.so/visuals/channel-order-signals-ambiguous-readings-table/channel-order-signals-ambiguous-readings-table.png" alt="Table of four channel order signals, such as orders up 20% or a regional spike, each with a demand reading and an equally likely stocking reading." width="1200" height="719" /></a>
<p>Source: <a href="https://www.koji.so/visuals/channel-order-signals-ambiguous-readings-table">What a change in channel orders could mean</a>, Koji</p>