Flowchart
Did the teaching change work? A difference-in-differences check
Three questions to ask before crediting a redesign with a rise in scores
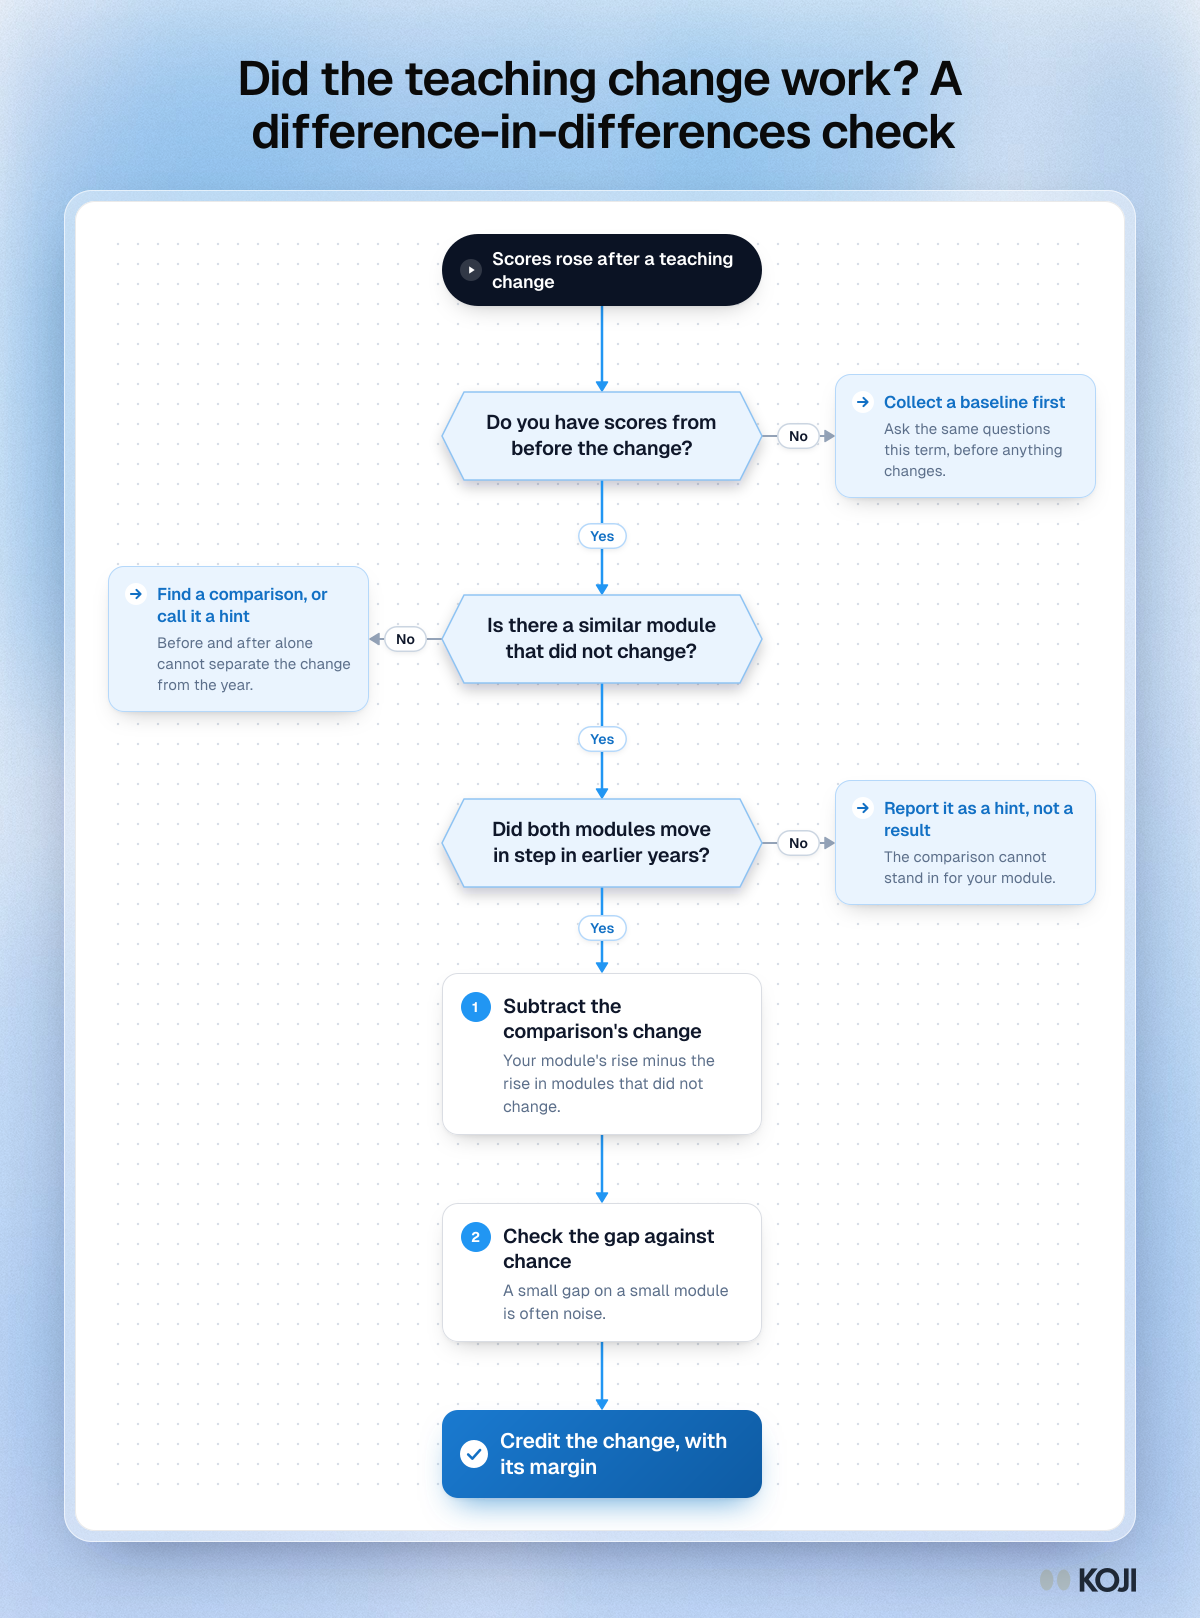
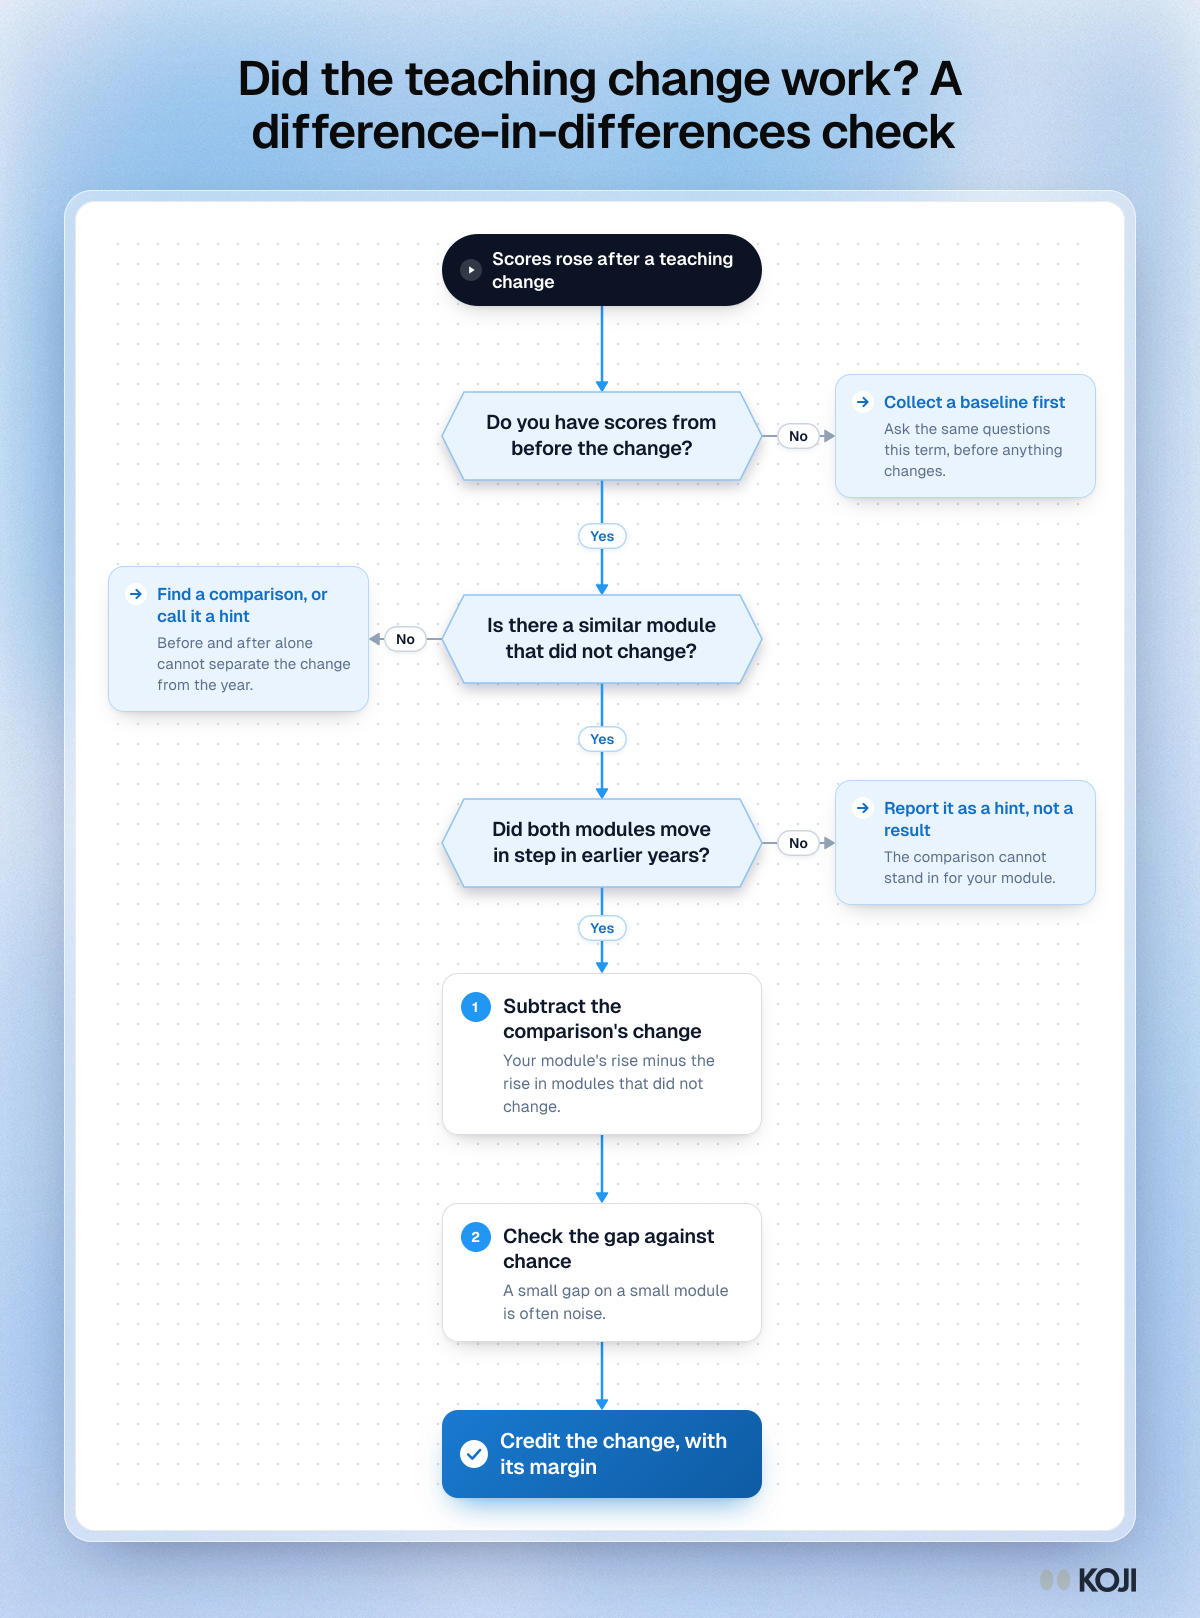
A decision flowchart for module leaders and quality teams who want to know whether a teaching change, not the year around it, raised a module's evaluation scores. It walks through the difference-in-differences logic: get a baseline, find a similar module that did not change, check that both moved together before, then subtract the comparison module's change. It follows Campbell and Stanley's warning about before-and-after designs and Card and Krueger's comparison-group method. Koji helps by asking the same questions in both modules each round.
What's in this flowchart
Start: Scores rose after a teaching change
- Do you have scores from before the change?
- Yes: go to 2.
- No: Collect a baseline first. Ask the same questions this term, before anything changes.
- Is there a similar module that did not change?
- Yes: go to 3.
- No: Find a comparison, or call it a hint. Before and after alone cannot separate the change from the year.
- Did both modules move in step in earlier years?
- Yes: go to 4.
- No: Report it as a hint, not a result. The comparison cannot stand in for your module.
- Subtract the comparison's change. Your module's rise minus the rise in modules that did not change.
- Check the gap against chance. A small gap on a small module is often noise.
- Finish: Credit the change, with its margin.
Use this image
Free to use in your docs, decks and posts under CC BY 4.0, as long as you credit Koji with a link to this page. To embed it, paste this into your page:
<a href="https://www.koji.so/visuals/credit-teaching-change-difference-in-differences-flowchart"><img src="https://www.koji.so/visuals/credit-teaching-change-difference-in-differences-flowchart/credit-teaching-change-difference-in-differences-flowchart.png" alt="Flowchart for deciding whether a teaching change explains a rise in course evaluation scores: three questions, ending in crediting the change with its margin." width="1200" height="1618" /></a>
<p>Source: <a href="https://www.koji.so/visuals/credit-teaching-change-difference-in-differences-flowchart">Did the teaching change work? A difference-in-differences check</a>, Koji</p>