Reference table
What to report instead of average customer lifetime
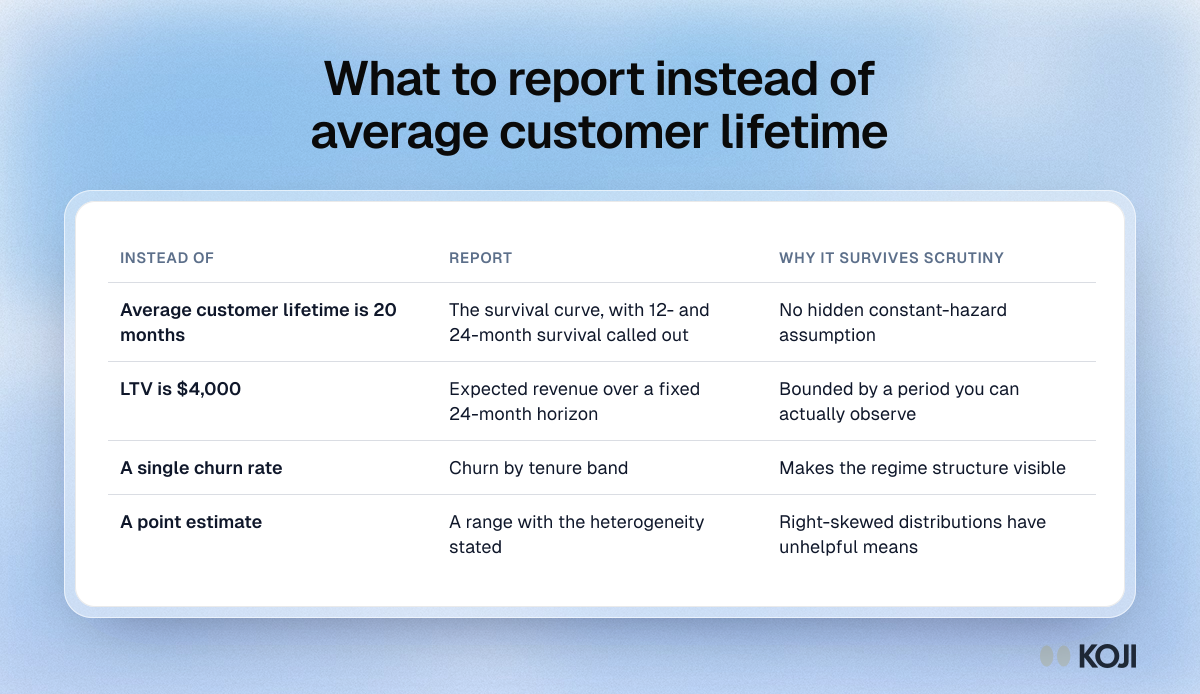
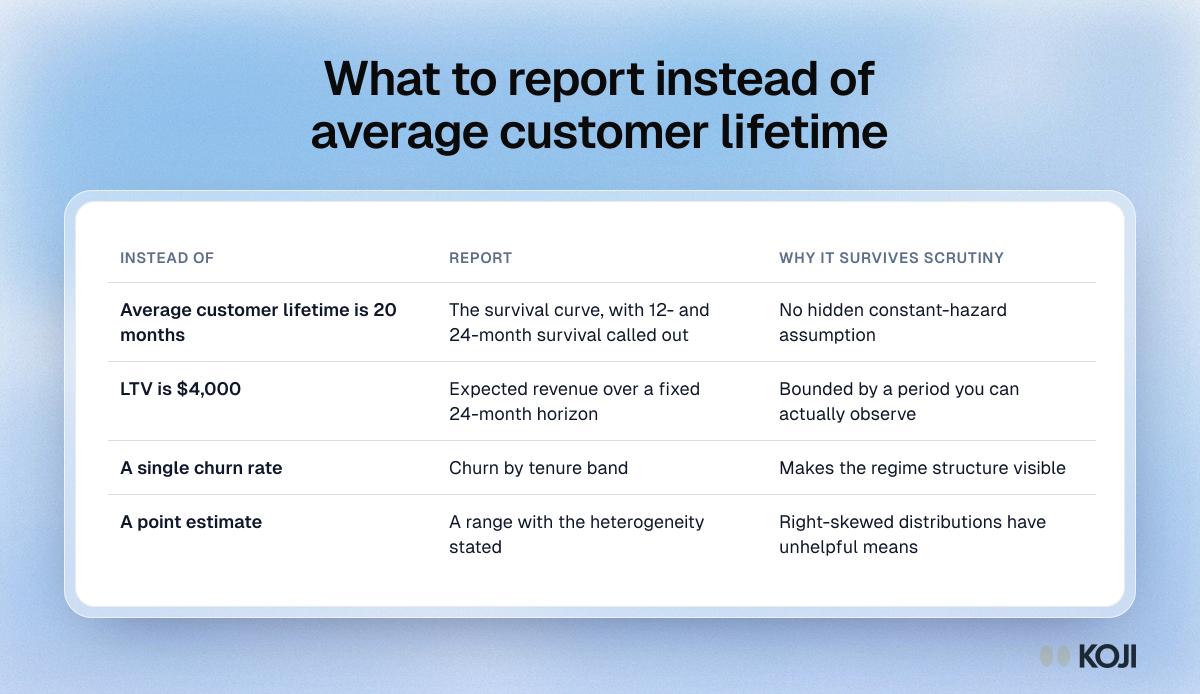
Four replacements for the numbers finance models usually quote about customers: a survival curve with 12 and 24 month survival instead of average lifetime, expected revenue over a fixed 24 month horizon instead of LTV, churn by tenure band instead of one churn rate, and a range instead of a point estimate. It is for founders, finance and growth teams who report customer lifetime value. Koji interviews by tenure band can then explain why the survival curve has the shape it has.
Where this appears
What's in this reference table
| Instead of | Report | Why it survives scrutiny |
|---|---|---|
| Average customer lifetime is 20 months | The survival curve, with 12- and 24-month survival called out | No hidden constant-hazard assumption |
| LTV is $4,000 | Expected revenue over a fixed 24-month horizon | Bounded by a period you can actually observe |
| A single churn rate | Churn by tenure band | Makes the regime structure visible |
| A point estimate | A range with the heterogeneity stated | Right-skewed distributions have unhelpful means |
Use this image
Free to use in your docs, decks and posts under CC BY 4.0, as long as you credit Koji with a link to this page. To embed it, paste this into your page:
<a href="https://www.koji.so/visuals/customer-lifetime-what-to-report-instead"><img src="https://www.koji.so/visuals/customer-lifetime-what-to-report-instead/customer-lifetime-what-to-report-instead.png" alt="Table of four swaps for LTV reporting: a survival curve instead of average lifetime, 24-month revenue instead of LTV, churn by tenure and ranges." width="1200" height="694" /></a>
<p>Source: <a href="https://www.koji.so/visuals/customer-lifetime-what-to-report-instead">What to report instead of average customer lifetime</a>, Koji</p>
Related
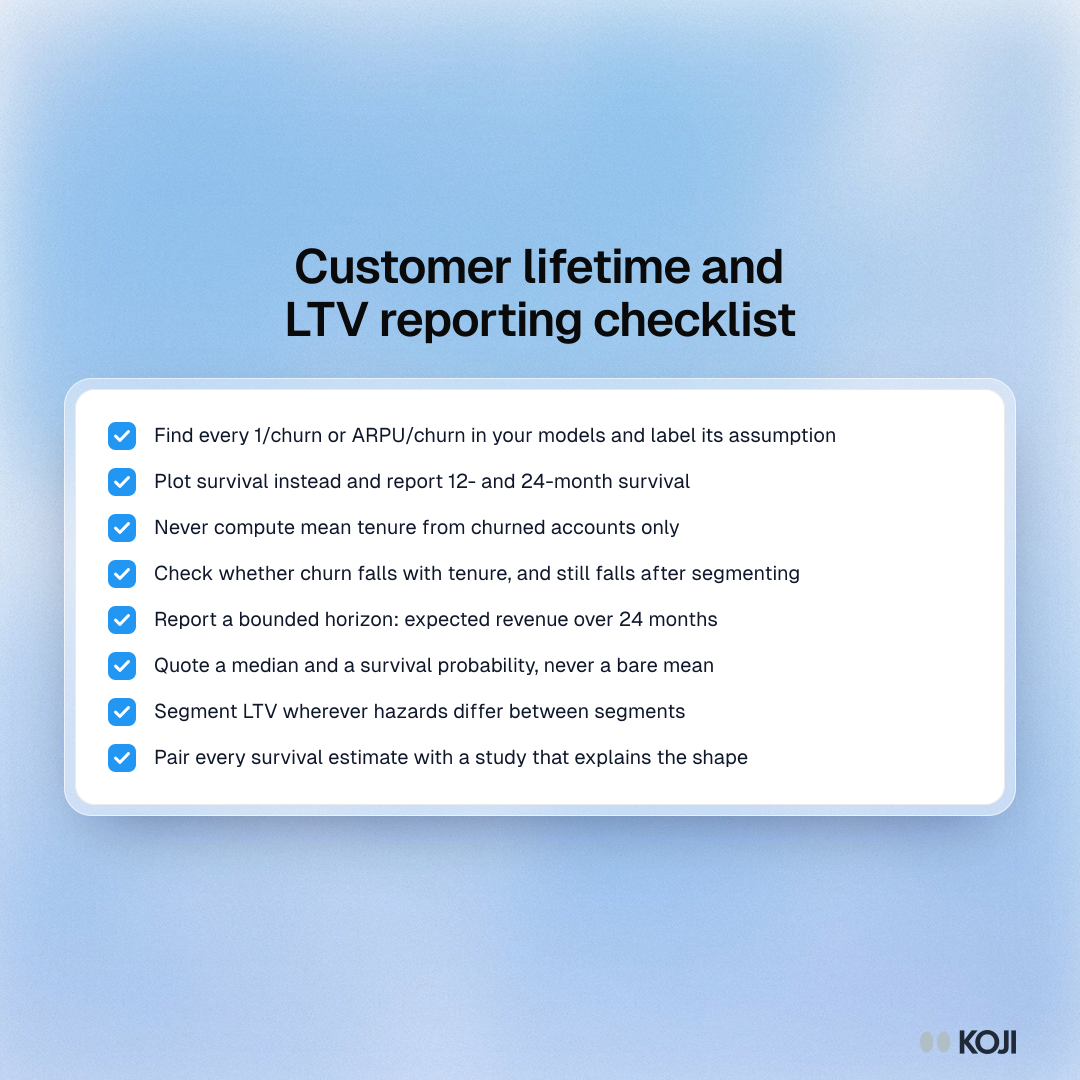
Customer lifetime and LTV reporting checklist
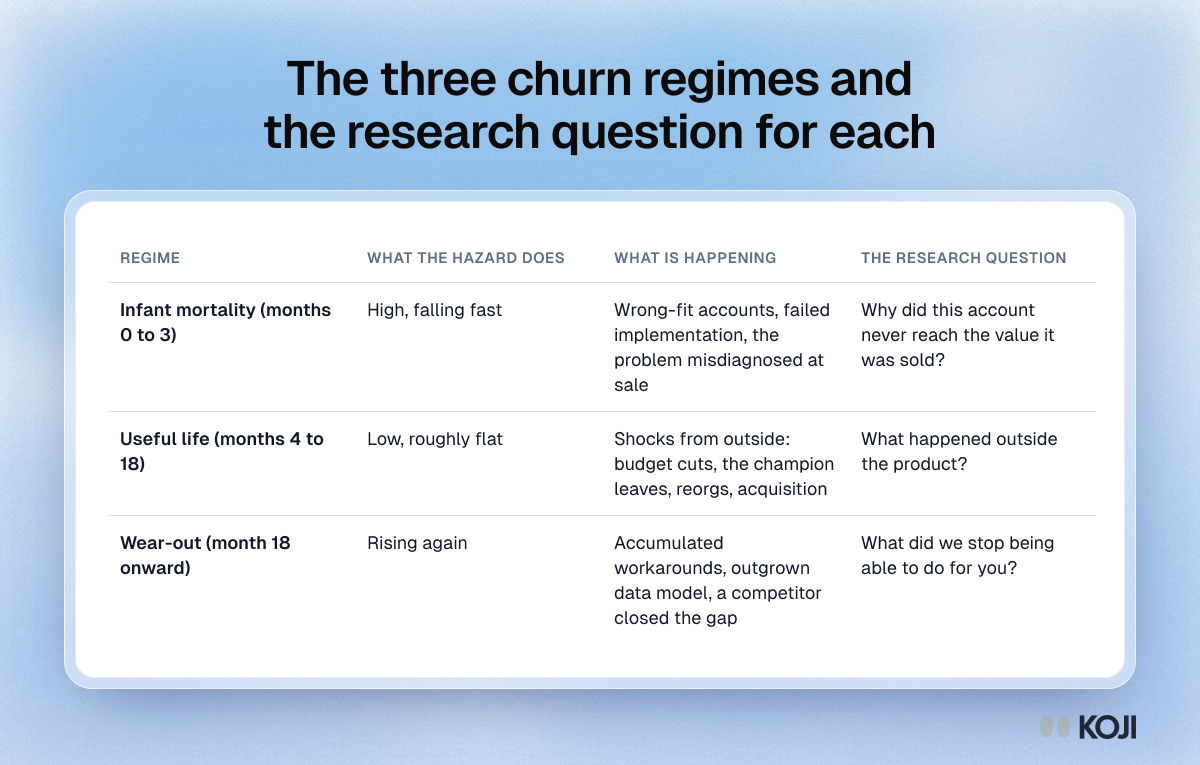
The three churn regimes and the research question for each
Which website feedback survey to use at each funnel stage
Microsoft Forms vs Google Forms for course evaluation
How much rapport-building each interview needs
The product marketing research stack, by workflow