Reference table
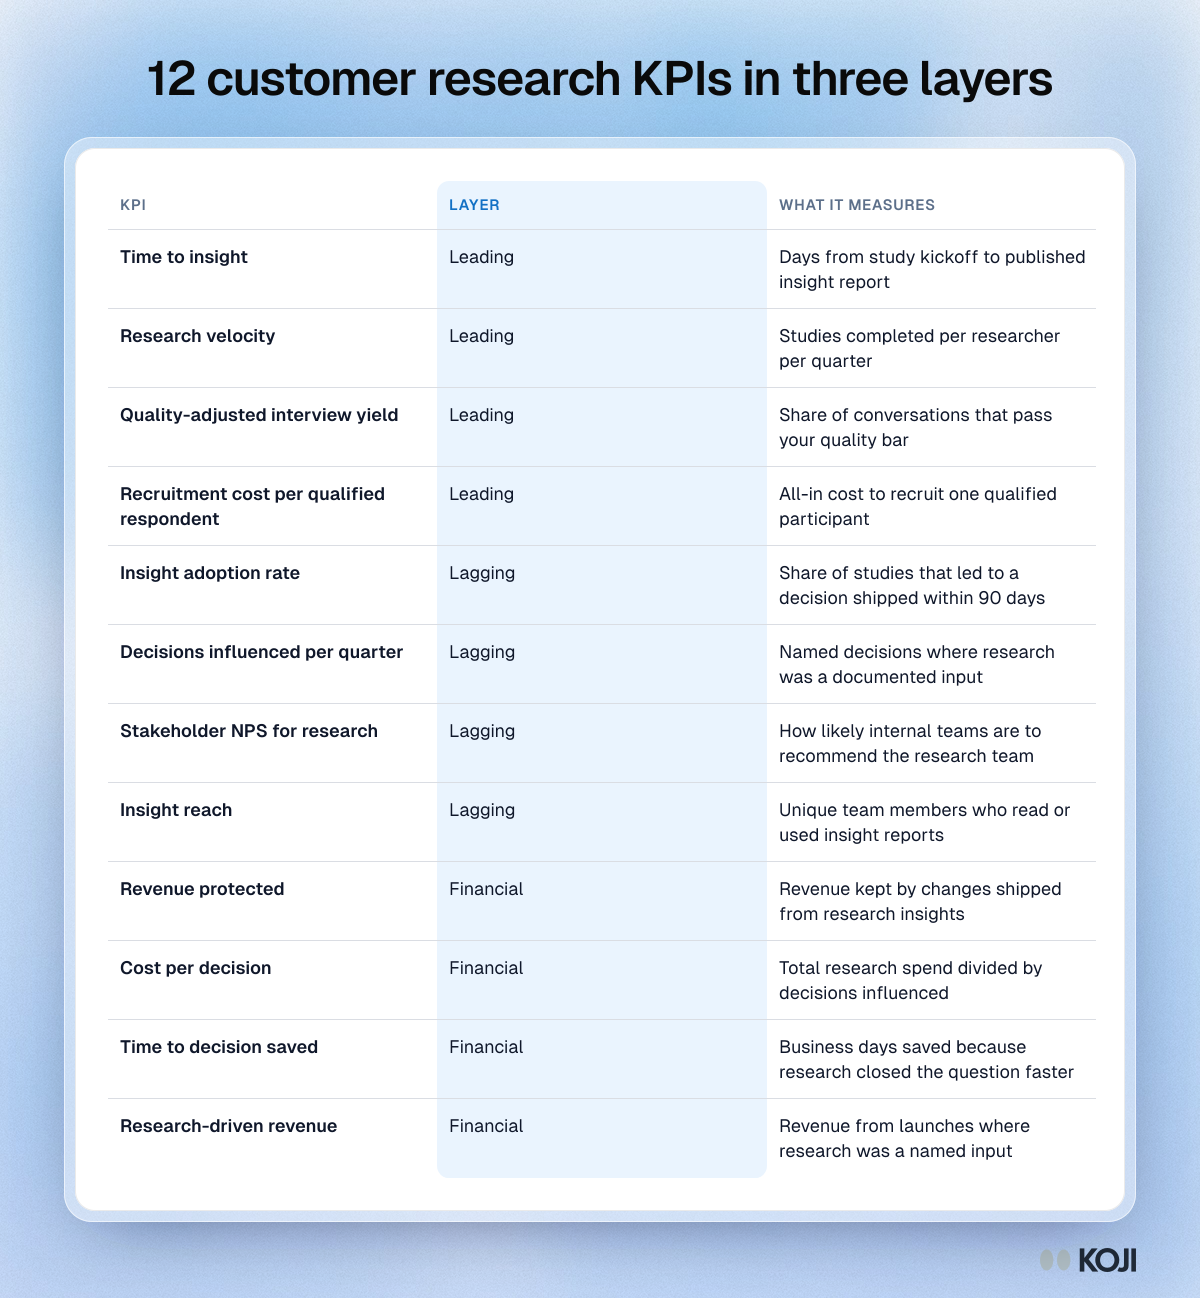
12 customer research KPIs in three layers
Leading indicators, lagging indicators and financial outcomes
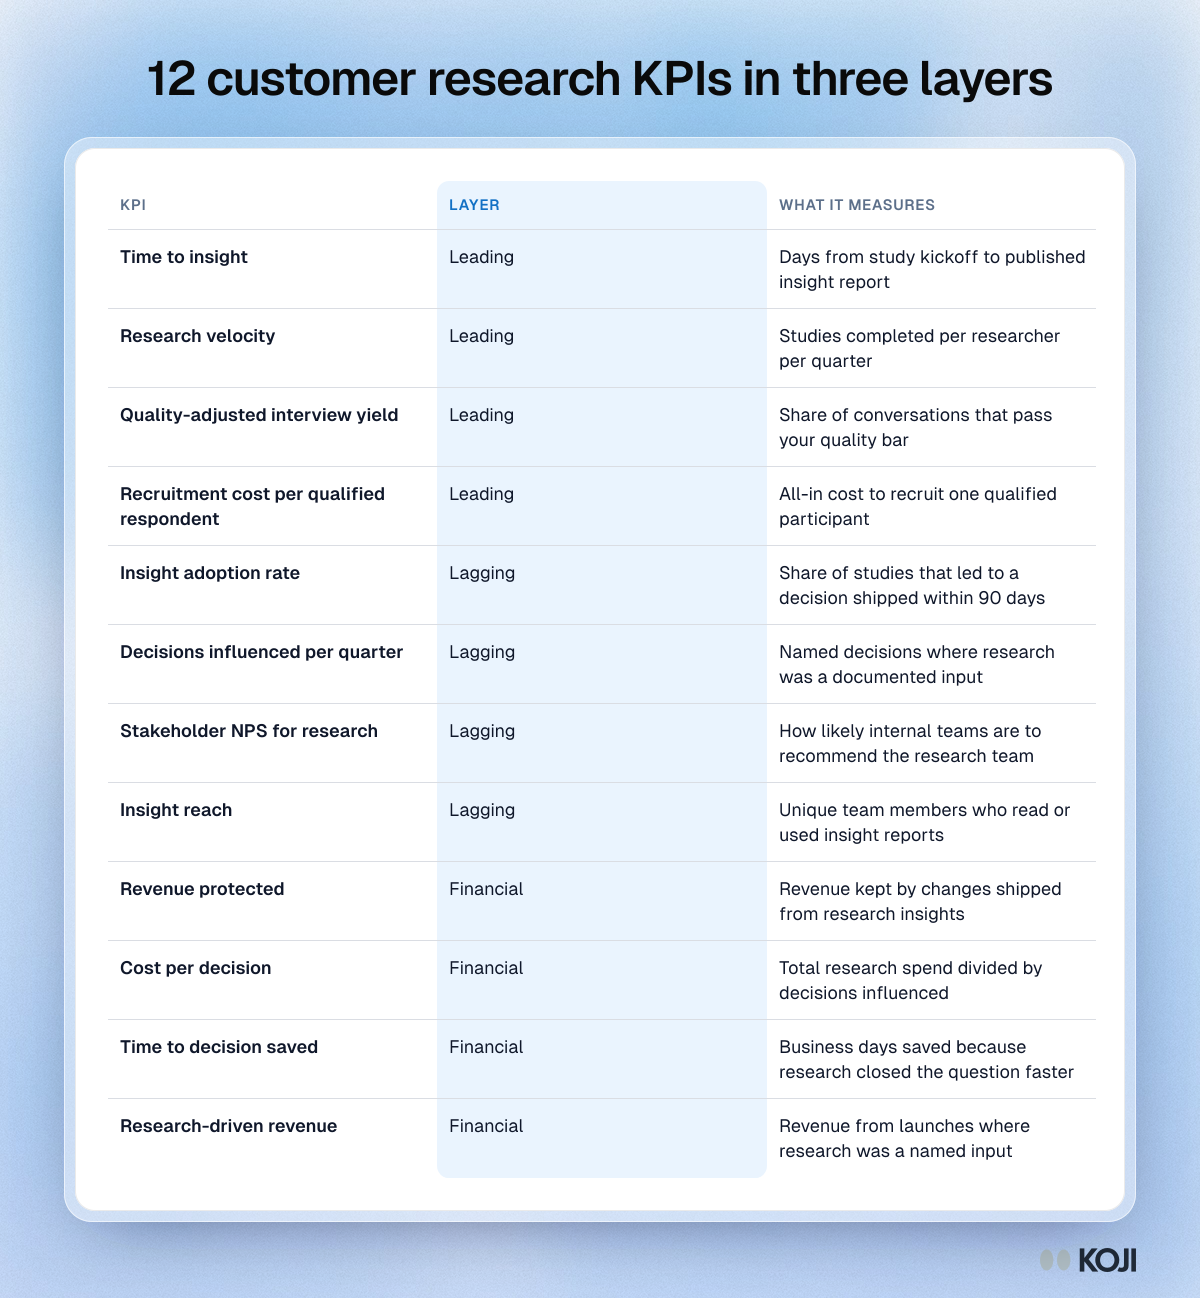
A reference table of twelve KPIs for a customer research team, in three layers. Leading indicators show whether the research engine is healthy, lagging indicators show whether insights changed decisions, and financial outcomes are the numbers a CFO asks for. Each row says what the metric measures. Pick three to start, one per layer, and review them monthly. Koji scores every interview for quality and tracks time to insight per study, which fills in part of the first layer.
Where this appears
What's in this reference table
| KPI | Layer | What it measures |
|---|---|---|
| Time to insight | Leading | Days from study kickoff to published insight report |
| Research velocity | Leading | Studies completed per researcher per quarter |
| Quality-adjusted interview yield | Leading | Share of conversations that pass your quality bar |
| Recruitment cost per qualified respondent | Leading | All-in cost to recruit one qualified participant |
| Insight adoption rate | Lagging | Share of studies that led to a decision shipped within 90 days |
| Decisions influenced per quarter | Lagging | Named decisions where research was a documented input |
| Stakeholder NPS for research | Lagging | How likely internal teams are to recommend the research team |
| Insight reach | Lagging | Unique team members who read or used insight reports |
| Revenue protected | Financial | Revenue kept by changes shipped from research insights |
| Cost per decision | Financial | Total research spend divided by decisions influenced |
| Time to decision saved | Financial | Business days saved because research closed the question faster |
| Research-driven revenue | Financial | Revenue from launches where research was a named input |
Use this image
Free to use in your docs, decks and posts under CC BY 4.0, as long as you credit Koji with a link to this page. To embed it, paste this into your page:
html
<a href="https://www.koji.so/visuals/customer-research-kpis-three-layers-table"><img src="https://www.koji.so/visuals/customer-research-kpis-three-layers-table/customer-research-kpis-three-layers-table.png" alt="Table of 12 customer research KPIs grouped as leading, lagging and financial, from time to insight to cost per decision and research-driven revenue." width="1200" height="1298" /></a>
<p>Source: <a href="https://www.koji.so/visuals/customer-research-kpis-three-layers-table">12 customer research KPIs in three layers</a>, Koji</p>