Reference table
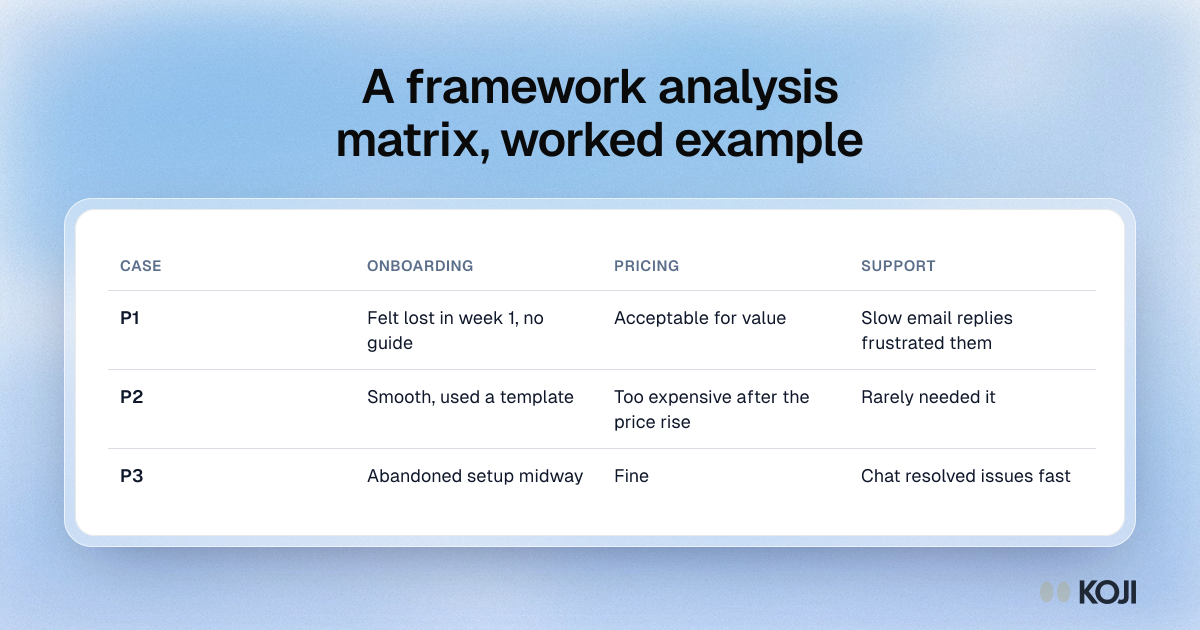
A framework analysis matrix, worked example
Three churned B2B customers charted against three themes
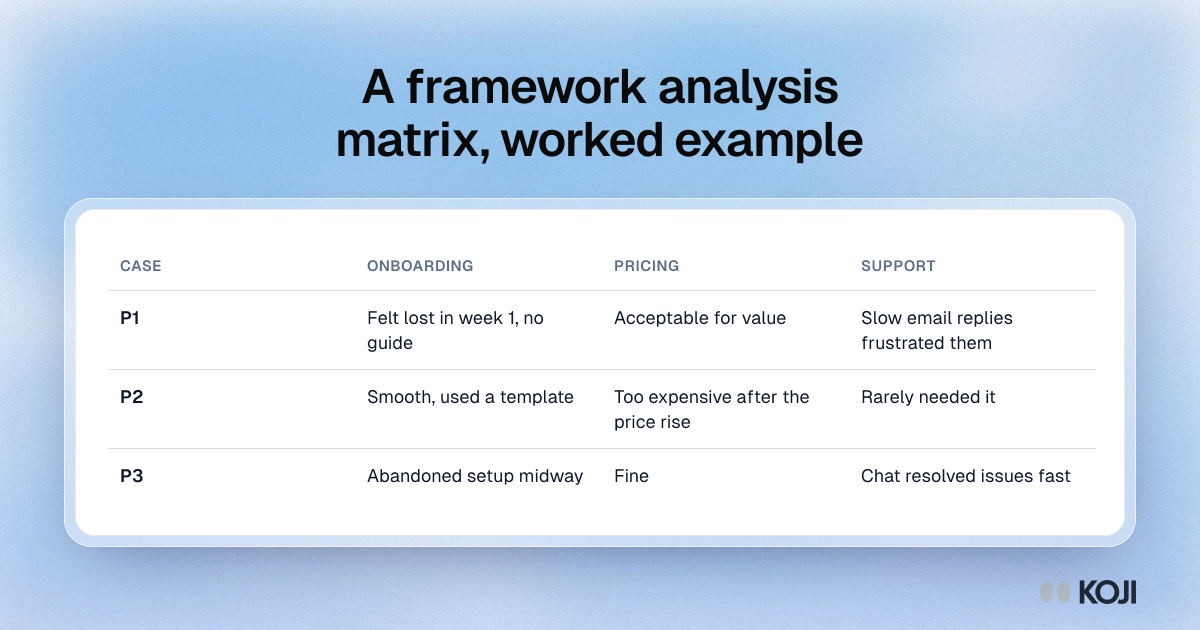
A worked example of the charting matrix at the centre of framework analysis. Each row is a participant from a churn study, each column a theme, and each cell a short summary of what that person said. Reading down the onboarding column shows a repeated churn driver, while reading across P3 shows a customer who left despite good support. Use it as a template for your own matrix, or start from a Koji report, which groups themes and quotes across interviews so you can read them case by case.
Where this appears
What's in this reference table
| Case | Onboarding | Pricing | Support |
|---|---|---|---|
| P1 | Felt lost in week 1, no guide | Acceptable for value | Slow email replies frustrated them |
| P2 | Smooth, used a template | Too expensive after the price rise | Rarely needed it |
| P3 | Abandoned setup midway | Fine | Chat resolved issues fast |
Use this image
Free to use in your docs, decks and posts under CC BY 4.0, as long as you credit Koji with a link to this page. To embed it, paste this into your page:
html
<a href="https://www.koji.so/visuals/framework-analysis-charting-matrix-example"><img src="https://www.koji.so/visuals/framework-analysis-charting-matrix-example/framework-analysis-charting-matrix-example.png" alt="Table showing a framework analysis matrix for a churn study: three participants as rows and onboarding, pricing and support as theme columns." width="1200" height="630" /></a>
<p>Source: <a href="https://www.koji.so/visuals/framework-analysis-charting-matrix-example">A framework analysis matrix, worked example</a>, Koji</p>