Stacked bar chart
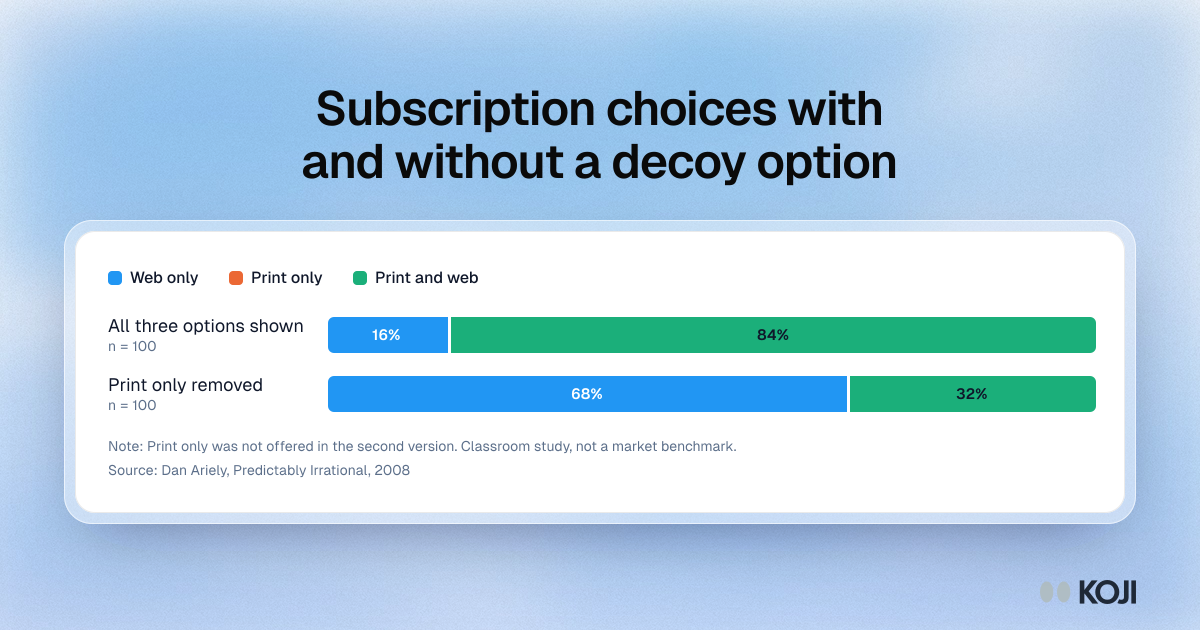
Subscription choices with and without a decoy option
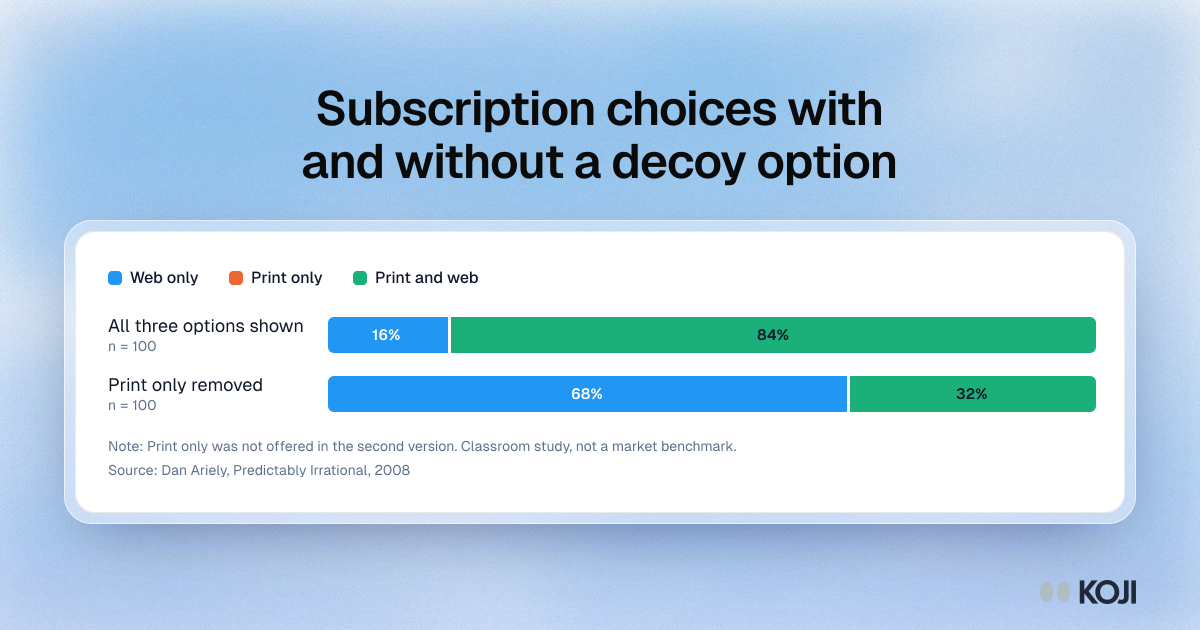
A stacked chart of the classroom experiment Dan Ariely describes in Predictably Irrational. With web only, print only and print and web on offer, 84 of 100 students chose print and web and none chose print only. With print only removed, 68 chose web only and 32 chose print and web. It is a simple illustration of the decoy effect for anyone designing pricing tiers. Treat it as a demonstration, not a benchmark.
Where this appears
What's in this stacked bar chart
| Web only | Print only | Print and web | Responses | |
|---|---|---|---|---|
| All three options shown | 16% | 0% | 84% | 100 |
| Print only removed | 68% | 0% | 32% | 100 |
Print only was not offered in the second version. Classroom study, not a market benchmark.
Use this image
Free to use in your docs, decks and posts under CC BY 4.0, as long as you credit Koji with a link to this page. To embed it, paste this into your page:
html
<a href="https://www.koji.so/visuals/decoy-pricing-subscription-choice-experiment"><img src="https://www.koji.so/visuals/decoy-pricing-subscription-choice-experiment/decoy-pricing-subscription-choice-experiment.png" alt="Stacked chart of how 100 students chose a subscription with and without a print-only decoy, showing print and web falling from 84 to 32" width="1200" height="630" /></a>
<p>Source: <a href="https://www.koji.so/visuals/decoy-pricing-subscription-choice-experiment">Subscription choices with and without a decoy option</a>, Koji</p>