Good-Better-Best Pricing: How to Research Your Tiers Before You Launch Them
How to research tiered pricing: why three tiers work, how decoy and compromise effects change which tier people choose, a six-step method for features, prices and the full lineup, the questions to ask and the common mistakes.
Good-better-best pricing means offering three versions of a product at three prices, so customers can pick the level of value they want. To research it well, you test three things separately: which features belong in which tier, what each tier should cost, and how people choose between the tiers once they see them side by side. The third one is where most teams get surprised, because the options you show change which option people pick. A tier almost nobody buys can still move a lot of people to the tier next to it.
This guide covers why tiers work, the choice effects that shape tier selection, a six-step research method and the mistakes that make tier research misleading.
Why three tiers
Tiered pricing does two jobs. It lets customers with different needs and budgets pay different amounts for the same core product, and it gives everyone a reference point. A single price invites the question "is this worth it?". Three prices change the question to "which one is right for me?".
Three is a common number because it gives a clear low, middle and high without asking much of the buyer. More options are not automatically worse, though. In the famous jam study, Iyengar and Lepper (2000) found that 30% of shoppers who stopped at a table of 6 jams bought one, against 3% at a table of 24. But when Scheibehenne, Greifeneder and Todd (2010) pooled 63 conditions from 50 experiments with 5,036 participants, the average choice overload effect was virtually zero, with large differences between studies. Choice overload is real in some settings and absent in others, so test your own tier count instead of assuming one.
How the options you show change the choice
Classic economics says adding an option nobody picks should not change how people choose between the others. Research on context effects says it does, in two well-documented ways.
The decoy effect. Huber, Payne and Puto (1982) showed that adding an option that is clearly worse than one existing option, but not clearly worse than another, raises the share choosing the option it is worse than. The decoy is rarely chosen. Its job is to make its neighbour look like a good deal.
The best-known illustration is a classroom experiment Dan Ariely describes in Predictably Irrational (2008), based on an old Economist subscription offer: web only for $59, print only for $125, or print and web for $125. When 100 students saw all three options, 16 chose web only, none chose print only and 84 chose print and web. When the print-only option was removed, 68 chose web only and 32 chose print and web.
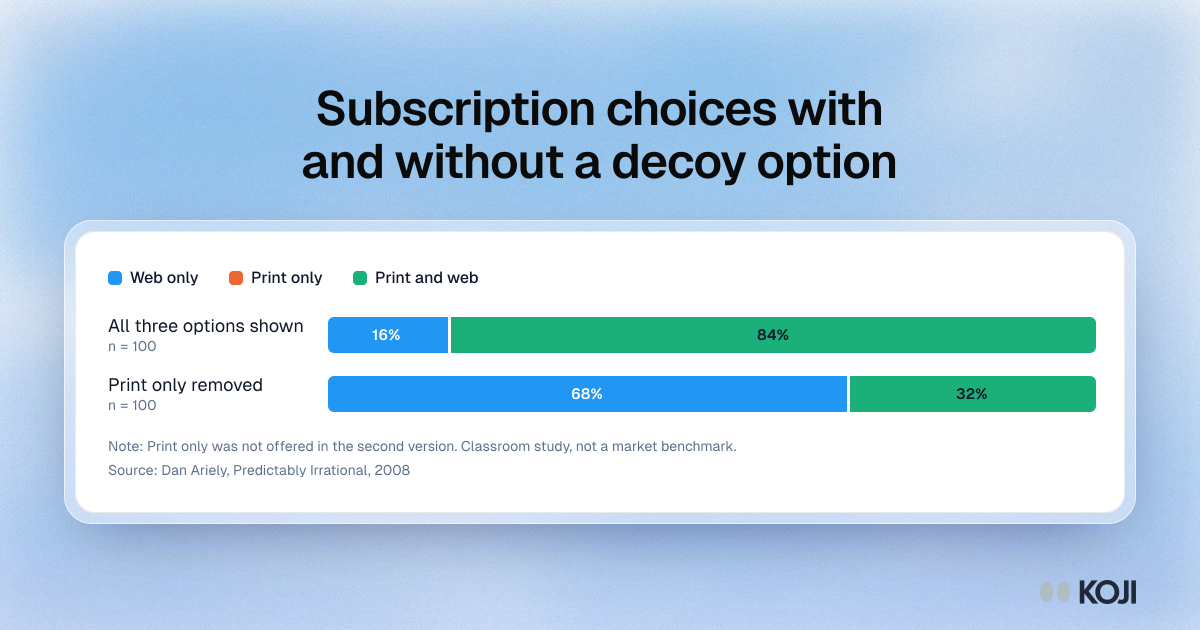
Treat this as a demonstration rather than a benchmark: it was a small classroom study, and real buyers have more time and more information. But it shows why you cannot test tiers one at a time and add the results up.
The compromise effect. Simonson and Tversky (1992) described a related pattern they called extremeness aversion: "the attractiveness of an option is enhanced if it is an intermediate option in the choice set and is diminished if it is an extreme option." This is part of why the middle tier in a good-better-best line often sells best, and why adding a premium tier above your current top plan can lift the plan that becomes the new middle.
What this means for research: the set of tiers is the thing you test, not each tier in isolation.
A six-step method for tier research
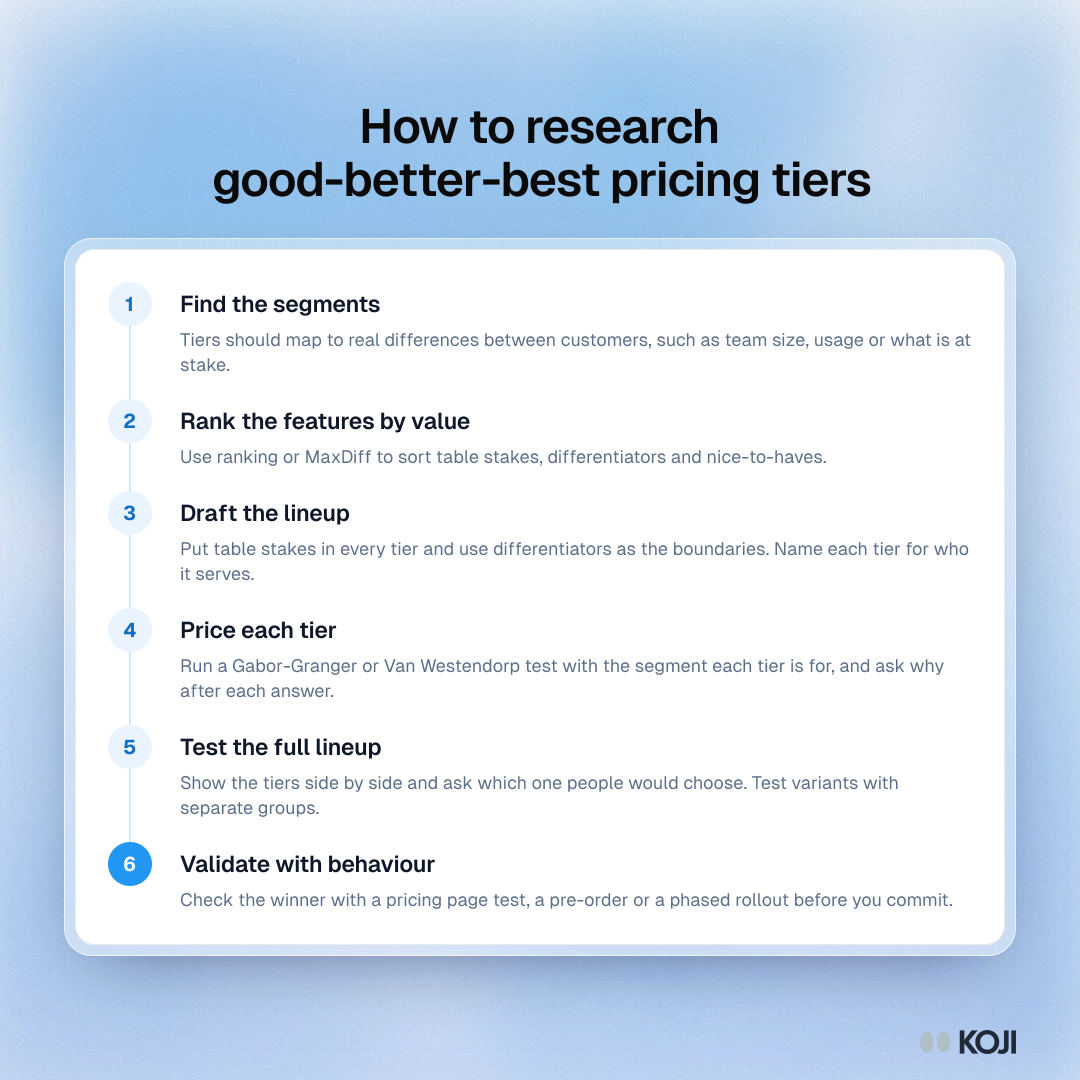
1. Find the segments first
Tiers should map to real differences between customers: team size, how often they use the product, what is at stake for them. Start with customer segmentation interviews and ask about the job, the budget and who signs off. If you cannot describe who each tier is for in one sentence, you are not ready to price it.
2. Rank the features by value
Ask people which features matter most to them. A ranking question works for short lists. For longer lists, MaxDiff forces trade-offs and gives a clean order. The aim is to find:
- table stakes: features everyone expects in every tier
- differentiators: features one segment values much more than others, which make good tier boundaries
- nice-to-haves: features few people value, which should not anchor a tier
3. Draft the lineup
Put the table stakes in every tier and use the differentiators to separate them. Give each tier a name that says who it is for. Write down the job each tier does: the entry tier gets people in, the middle tier is where you want most people, the top tier serves the most demanding segment and anchors the others.
4. Price each tier
Run a price test per tier with the people that tier is for. A Gabor-Granger test finds the highest price each person would still buy at, and the revenue each price implies. Van Westendorp gives you an acceptable range. Ask "What makes you say that?" after each answer, because the reasons tell you whether the price or the package is the problem.
5. Test the full lineup
Now show the three tiers together, as they would appear on a pricing page, and ask which one people would choose and why. Then try a variant: a different middle price, a premium tier added on top, a feature moved down a tier. Show each variant to a separate group of people so no one compares versions. Look at how the share choosing each tier moves.
6. Validate with behaviour
Stated choices are a guide, not a forecast (see purchase intent). Before you commit, check the winner with something people actually do: a pricing page test, a pre-order, or a phased rollout to new signups.
Questions to ask in tier research
- Which of these plans would you choose? What makes you pick that one over the one next to it?
- What would have to be in the cheaper plan for you to choose it instead?
- Is there anything in the plan you chose that you would not use?
- Who else would need to agree before you bought this plan?
- If this plan cost 20% more, what would you do?
Common mistakes
- Testing tiers one at a time. Context effects mean a tier's appeal depends on what sits next to it. Test the lineup.
- Asking about features without trade-offs. If you ask "how important is this feature?", everything is important. Force a choice with ranking or MaxDiff.
- Using a decoy you would not want anyone to buy. A tier exists to be bought by someone. A tier designed only to manipulate damages trust when customers notice, and they do.
- Testing with the wrong people. Your current power users will happily choose the top tier. Test each tier with the segment it is for.
- Showing several lineups to the same person. They start comparing your test versions instead of choosing a plan. Use separate groups.
- Stopping at the numbers. A 60% share for the middle tier tells you what people chose, not why, and not whether they would still choose it at a higher price.
Running tier research with real people
Pricing conversations work best when people talk about their own situation rather than the product in the abstract. Ask about the last time they bought a tool like this, who was involved and what made them pick one plan. Then show your lineup and listen for the moment they start comparing tiers out loud. That moment, where someone says "I'd want the middle one, but only because of the reporting", is the data you are after.

Photo by Detail .co on Unsplash
How Koji helps
Koji runs AI-moderated interviews by voice or text, so every tier choice comes with the reasoning behind it.
- Show the lineup. Attach an image to any question, such as a draft pricing page or a tier comparison table, and participants react to what they see. Koji knows what the image shows, so its follow-ups are about your tiers.
- Choice questions for tier selection. Ask which plan people would choose as a single choice question, with the options shuffled for each participant so no tier always appears first.
- Ranking and multiple choice for features. Rank features by importance, or let people pick their top few with a set minimum and maximum, to sort table stakes from differentiators.
- Price tests per tier. The Price Test (Gabor-Granger) question asks how likely people are to buy at one price at a time, moving up or down your ladder until it finds the highest price they would still buy at, then asks why. The report shows the share who would buy at each price, the revenue each implies and the price that earns the most. It reads best from about 30 interviews per test.
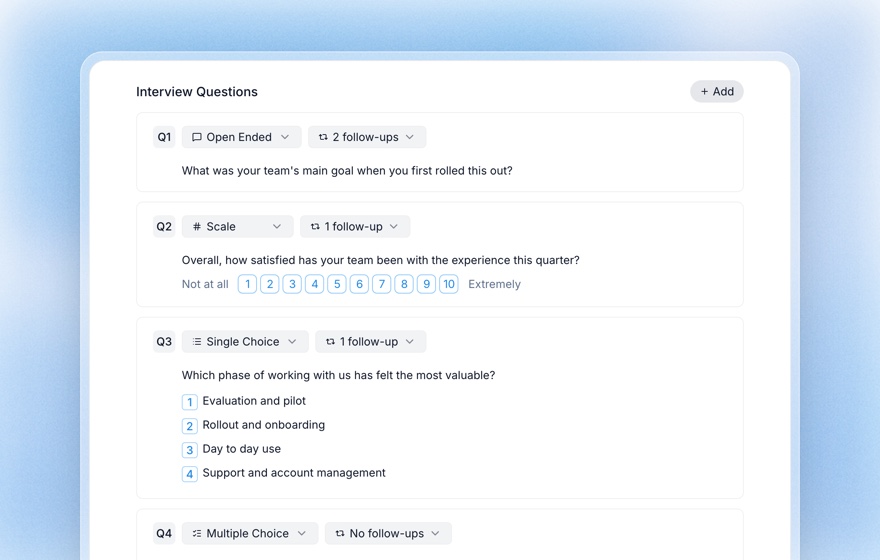
- Follow-ups on every answer. You choose from none to three follow-up questions per question, so "I'd pick the middle one" turns into what made the difference.
You can build a tier study yourself from a free account, or ask the research assistant to help you test pricing for your product.
Related Resources
- Gabor-Granger pricing method
- Van Westendorp price sensitivity meter
- MaxDiff analysis guide
- Purchase intent scale
- Pricing research interviews
- Structured questions guide
Sources
- Ariely, D. (2008). Predictably Irrational: The Hidden Forces That Shape Our Decisions. HarperCollins.
- Huber, J., Payne, J. W., & Puto, C. (1982). Adding asymmetrically dominated alternatives: Violations of regularity and the similarity hypothesis. Journal of Consumer Research, 9(1), 90–98.
- Iyengar, S. S., & Lepper, M. R. (2000). When choice is demotivating: Can one desire too much of a good thing? Journal of Personality and Social Psychology, 79(6), 995–1006.
- Scheibehenne, B., Greifeneder, R., & Todd, P. M. (2010). Can there ever be too many options? A meta-analytic review of choice overload. Journal of Consumer Research, 37(3), 409–425.
- Simonson, I., & Tversky, A. (1992). Choice in context: Tradeoff contrast and extremeness aversion. Journal of Marketing Research, 29(3), 281–295.
Related Articles
Gabor-Granger Pricing Method: Find Your Revenue-Maximizing Price
A practical guide to the Gabor-Granger pricing method — how it works, a worked revenue-curve example, its limitations, how it compares to Van Westendorp and conjoint, and how to run it with AI.
MaxDiff Analysis: The Complete Guide to Maximum Difference Scaling (2026)
Learn how MaxDiff (Maximum Difference Scaling) produces sharper feature and message prioritization than rating scales — and how to pair it with conversational AI interviews to capture the why behind every score.
Pricing Research Interviews: How to Understand What Customers Will Pay
Discover how to run qualitative pricing research interviews that reveal willingness to pay, price anchors, and the emotional logic behind buying decisions — beyond what surveys can surface.
Purchase Intent Scale: How to Ask "Would You Buy This?" and Read the Answer
How the 5-point purchase intent scale works, how to score it as top-box or top-2-box, what the research says about when intent predicts sales, the 11-point Juster probability scale and how to pair the score with the reasons behind it.
Structured Questions in AI Interviews
Mix quantitative data collection — scales, ratings, multiple choice, ranking — with AI-powered conversational follow-up in a single interview.
Van Westendorp Price Sensitivity Meter: The Four-Question Pricing Research Method
The Van Westendorp Price Sensitivity Meter uses four questions to identify the optimal price for any product. Learn how to run the PSM with AI interviews at scale and combine the four numbers with qualitative reasoning.