Pairwise Comparison: How to Rank Options One Pair at a Time
How pairwise comparison works, how many pairs you need, how to run and analyse a study, how wiki surveys scale it to hundreds of ideas, and when to use ranking, rating or MaxDiff instead.
Pairwise comparison is a way to rank options by showing people two at a time and asking which they prefer. It works because picking between two things is easier and more honest than ranking a long list or rating each item on a scale. Its weakness is the number of pairs: a full round grows quickly, so for more than about eight options you show each person a sample of pairs and combine the answers statistically.
This guide covers how the method works, how many pairs you need, how to run and analyse a study, how wiki surveys scale it to hundreds of ideas, and when to use something else.
What pairwise comparison is
In a pairwise comparison (also called paired comparison), each question shows two options and asks the participant to choose one: "Which of these two features would you rather we built first?" Across many pairs and many people, the choices add up to an ordering of every option, often with a score that shows how far apart they are.
The method is old. Psychologist L. L. Thurstone set out a statistical model for paired comparisons in his 1927 "law of comparative judgment", and Ralph Bradley and Milton Terry published the model most tools still use in 1952. Today you'll find pairwise comparison in places as different as chess ratings, sports rankings, decision-making methods such as the Analytic Hierarchy Process and the human preference data used to train AI models.
For product and UX research it answers questions like:
- Which of these 12 feature ideas matter most to customers?
- Which of five value propositions is most compelling?
- Which pain points should the roadmap tackle first?
- Which of several names, headlines or designs do people prefer?
Why compare in pairs
Three things make pairs attractive:
- Easier judgements. Choosing between two options is a simpler task than holding ten in your head and ordering them. A review of paired comparison models by Manuela Cattelan (2012) makes the same point: people find it easier to compare two objects than to rank a list.
- No scale to interpret. Ratings suffer from people using scales differently: one participant's 7 is another's 9. A choice between A and B has no such problem.
- Forced trade-offs. When everything can be rated "very important", ratings flatten out. A pair makes the participant give something up, which is closer to how real decisions work.
The cost is volume. Every extra option adds a row of new pairs.
How many pairs you need
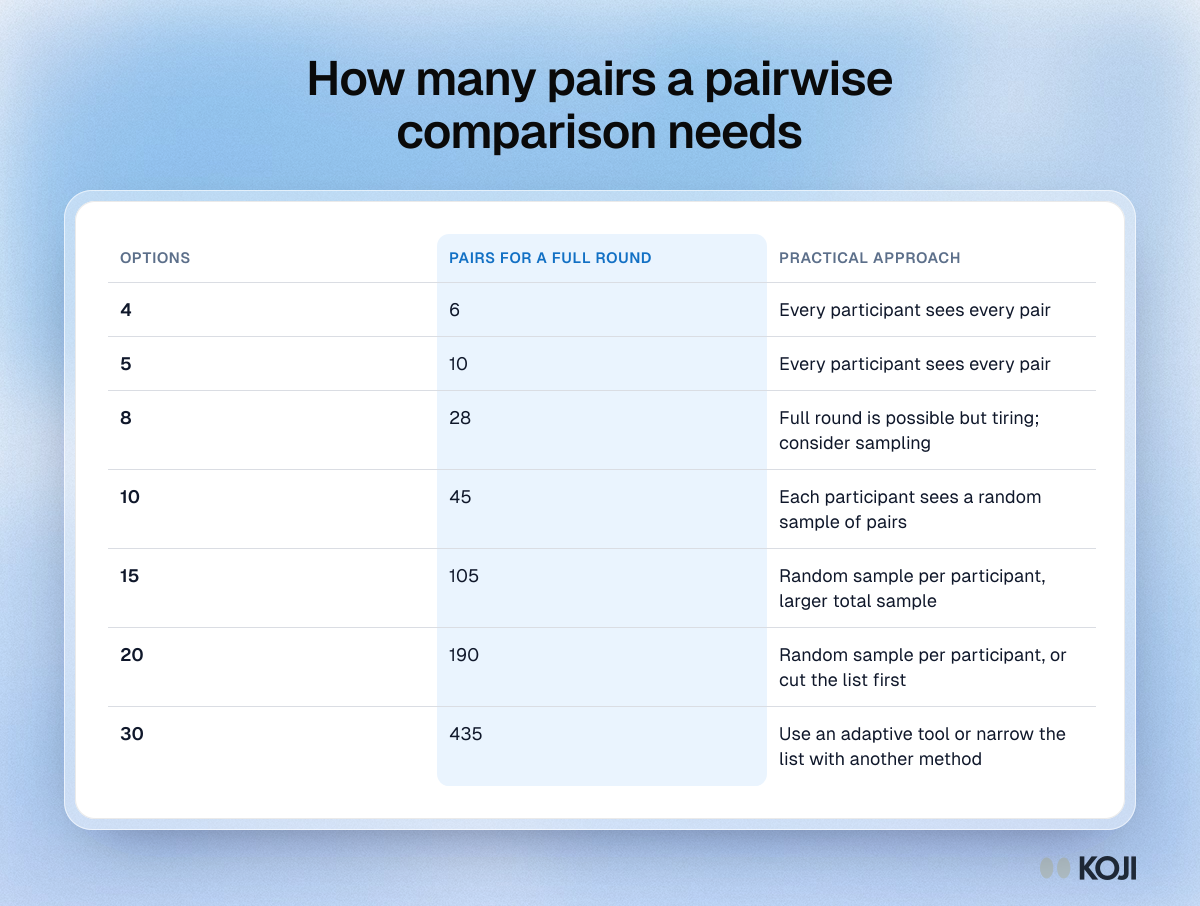
A full round, where every option meets every other option once, needs n x (n - 1) / 2 pairs. The number grows faster than most people expect:
| Options | Pairs for a full round | Practical approach |
|---|---|---|
| 4 | 6 | Every participant sees every pair |
| 5 | 10 | Every participant sees every pair |
| 8 | 28 | Full round is possible but tiring; consider sampling |
| 10 | 45 | Each participant sees a random sample of pairs |
| 15 | 105 | Random sample per participant, larger total sample |
| 20 | 190 | Random sample per participant, or cut the list first |
| 30 | 435 | Use an adaptive tool or narrow the list with another method |
You don't need every person to see every pair. If each participant answers a random selection and you have enough participants, every pair gets covered across the sample, and a model such as Bradley-Terry fills in the overall ranking.
How to run a pairwise comparison study
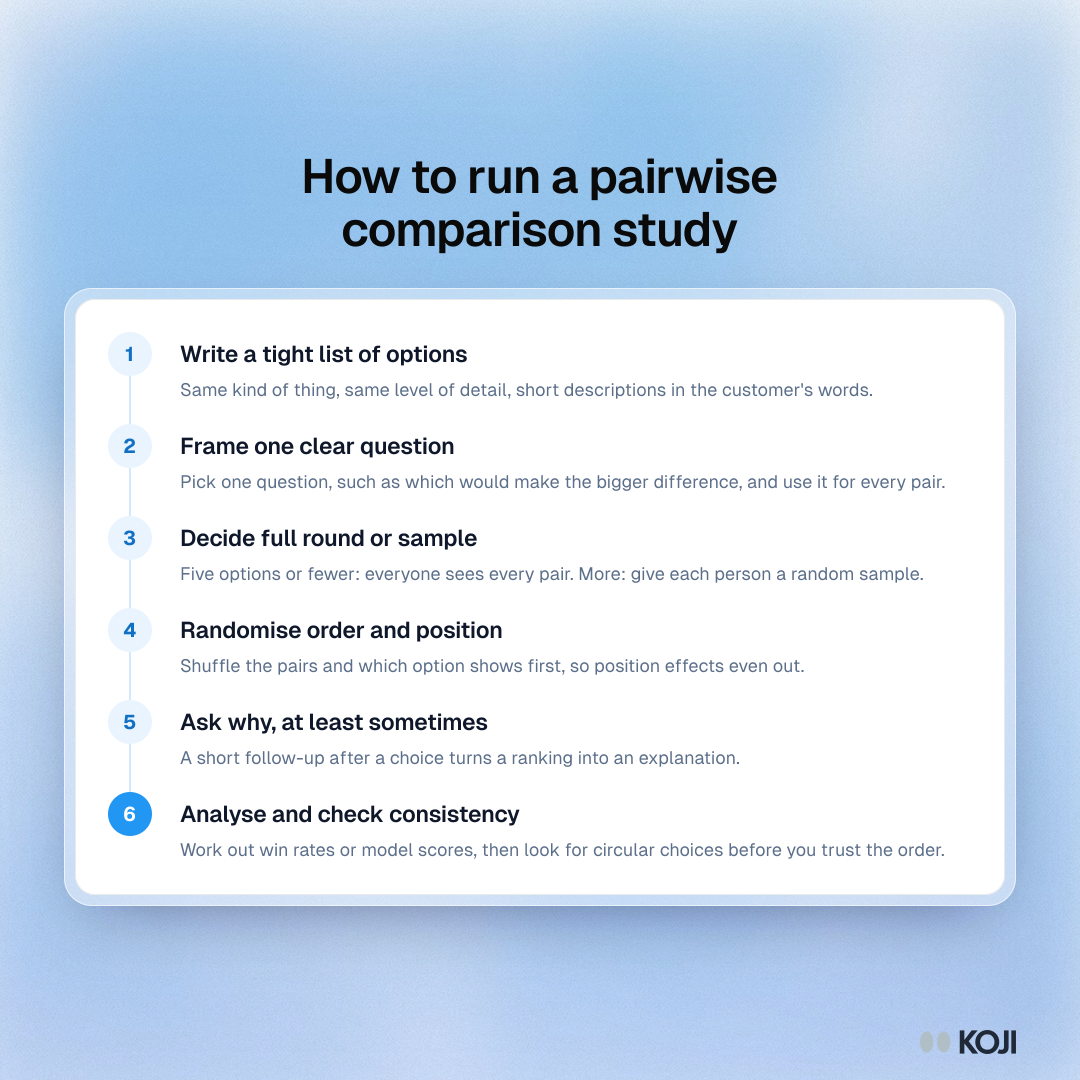
1. Write a tight list of comparable options
Every option should be the same kind of thing at roughly the same level of detail. "Faster search" against "A complete redesign of reporting" isn't a fair fight. Keep descriptions short and in the customer's language.
2. Frame one clear question
"Which would make the bigger difference to your work?" is a different question from "Which would you pay more for?" Pick one and use the same wording for every pair.
3. Decide full round or sample
Use the table above. For five or fewer options, show everyone every pair. Beyond that, decide how many pairs each person sees. Keep the load light enough that people stay focused, and check it in a pilot.
4. Randomise order and position
Shuffle the order of the pairs and which option appears first. Position can nudge a choice, and randomising spreads that effect evenly across options.
5. Ask why, at least sometimes
A choice tells you which option won. It doesn't tell you why. Adding a short "what made you pick that one?" after some pairs turns a ranking into an explanation.
6. Analyse and check consistency
Calculate the results (see below), then look for contradictions before you trust the order.
Analysing the results
There are three common levels of analysis.
Win rate. For each option, divide the number of times it was chosen by the number of times it appeared. It's simple, easy to explain and fine when every option appeared about equally often.
Bradley-Terry scores. The Bradley-Terry model estimates a strength for each option so that the chance of A beating B depends on the gap between their strengths. It handles uneven coverage and gives scores you can compare on one scale. Most statistics packages include it.
Consistency checks. If a participant prefers A to B and B to C, they should prefer A to C. Count how often that breaks (a "circular triad"). A few breaks are normal. Many suggest the options weren't clear or the participant wasn't paying attention. In the Analytic Hierarchy Process, which uses rated pairwise comparisons to weight criteria, Thomas Saaty's rule of thumb is to accept a set of judgements with a consistency ratio of 0.10 or less and revise anything above.
Pairwise at scale: wiki surveys
Pairwise comparison can also handle long lists that grow while the study runs. Matthew Salganik and Karen Levy at Princeton built a tool called All Our Ideas around this and described it in a 2015 PLOS ONE paper. They argue such "wiki surveys" should be "greedy, collaborative, and adaptive": take as much information as each person will give, let participants add new options, and choose the next pair based on what's already known.
Their best-known case was a wiki survey for New York City's sustainability plan, PlaNYC. The Mayor's Office seeded it with 25 ideas, and residents contributed 464 more. In total 1,436 respondents gave 31,893 responses. Eight of the ten highest-scoring ideas were ones respondents had contributed, not the city's own seeds.
The lesson for product teams: if you only test your own list, you may miss the options participants care about most. Leave room for new ideas.
Running pairwise comparisons in interviews
A survey gives you a ranking. An interview gives you the ranking and the reasons. When you run pairwise questions inside a conversation, a few habits help:

- Keep pairs to the options that matter. In an interview, three to six pairs is plenty. Use the rest of the time to ask why.
- Ask about the hard choices. When a participant hesitates, that pair is close for them. Ask what would tip it.
- Listen for a third option. "Honestly, neither. What I need is..." is often the most useful answer in the study.
- Check that options mean the same thing to everyone. If a participant describes an option differently from how you wrote it, note it. That option may need rewording.
Pairwise vs ranking, rating and MaxDiff
- Ranking asks people to order the whole list at once. It's fast for short lists, but the lower positions get less reliable as the list grows. See choice and ranking questions and average rank analysis.
- Rating asks for a score on each item. It's quick but suffers from everyone rating everything high. See ranking vs rating questions.
- MaxDiff shows sets of four or five and asks for the best and the worst. It gets more information per screen than pairs. See MaxDiff analysis.
- Pairwise is the simplest choice task and the easiest to explain, and it's the natural fit when you want to ask why after each choice.
Common mistakes
- Too many options. Cut the list with a quick screen or rating question first.
- Mixing levels. Small fixes compared with big bets always lose. Group like with like.
- No "why". A ranking without reasons is hard to act on.
- Ignoring ties and contradictions. If two options are within noise of each other, say so instead of declaring a winner.
How Koji helps
Koji runs AI-moderated interviews by voice or text with structured questions built into the conversation, so you can collect pairwise choices and the reasons behind them in one study.
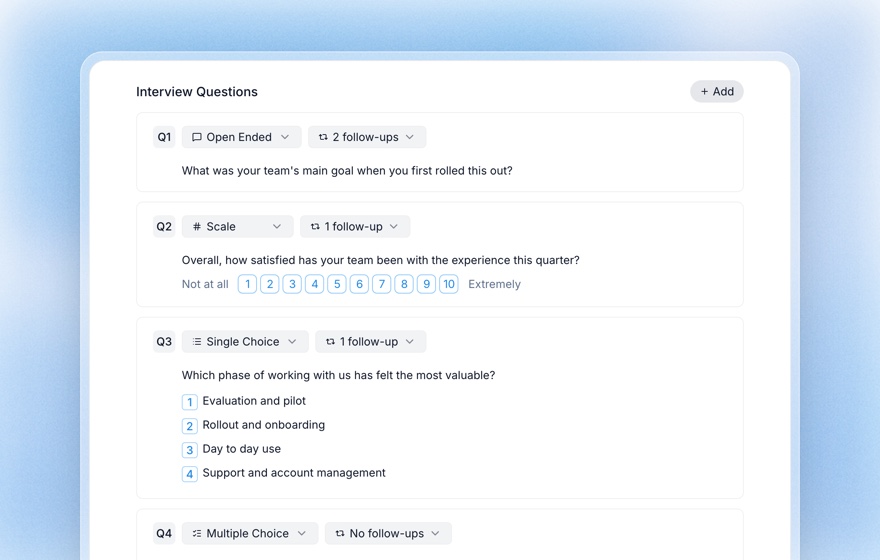
- Set up each pair as a choice. Add a single choice question with the two options for each pair you want to test. In text interviews participants tap their answer, and the report charts how often each option was picked.
- Ask why automatically. Each question can have AI follow-ups, up to three per question, so after a choice the interviewer asks what made the participant pick it. Those answers feed the thematic analysis in the report.
- Rank the full list when it's short. For a short list, a ranking question lets participants drag items into order, and the report shows each item's average rank.
- Catch the third option. Because the interview is a conversation, "neither, what I really need is..." gets captured and can surface as its own theme.
Related Resources
- Forced-choice survey questions
- Ranking vs rating questions
- MaxDiff analysis guide
- Average rank: analysing ranking questions
- Feature prioritization survey guide
- Structured questions guide
Sources
- Bradley, R. A., & Terry, M. E. (1952). Rank analysis of incomplete block designs: I. The method of paired comparisons. Biometrika, 39(3/4), 324–345.
- Cattelan, M. (2012). Models for paired comparison data: A review with emphasis on dependent data. Statistical Science, 27(3), 412–433.
- Saaty, T. L. (1980). The Analytic Hierarchy Process. McGraw-Hill.
- Salganik, M. J., & Levy, K. E. C. (2015). Wiki surveys: Open and quantifiable social data collection. PLOS ONE, 10(5), e0123483.
- Thurstone, L. L. (1927). A law of comparative judgment. Psychological Review, 34(4), 273–286.
Related Articles
Why Adding One Option Can Reverse Your Ranking Results (2026)
Average rank, the default summary for ranking questions, depends on which other options are in the list. A worked example of a reversal no respondent caused, and the first-place and pairwise summaries that stay stable.
Forced-Choice Questions: How to Eliminate Fence-Sitting and Get Decisive Data
Forced-choice questions remove the neutral or "no opinion" escape hatch so respondents have to commit to a real preference. Learn when to use them, how to write them without bias, and how AI interviews recover the reasoning you would otherwise lose.
MaxDiff Analysis: The Complete Guide to Maximum Difference Scaling (2026)
Learn how MaxDiff (Maximum Difference Scaling) produces sharper feature and message prioritization than rating scales — and how to pair it with conversational AI interviews to capture the why behind every score.
Ranking vs. Rating Questions: Which to Use and When
Rating questions score each item independently and scale easily; ranking questions force trade-offs and reveal true priorities. Learn the strengths, weaknesses, and biases of each, and how to choose the right format for clean, decision-ready data.
Structured Questions in AI Interviews
Mix quantitative data collection — scales, ratings, multiple choice, ranking — with AI-powered conversational follow-up in a single interview.
5-Point vs 7-Point Likert Scale: How Many Scale Points Should You Use? (2026)
A decision guide for rating-scale length — what the reliability research actually says about 5 vs 7 points, the odd-vs-even and neutral-midpoint debates, when each fits, and how AI follow-ups make any scale richer.