NASA-TLX: How to Measure Perceived Workload in UX Research
The NASA-TLX rates six dimensions of workload after a task. How to run it, score it as weighted or Raw TLX, read the results and find out why a task felt hard.
The NASA-TLX (NASA Task Load Index) is a short questionnaire that measures how demanding a task felt to the person who did it. Right after the task, participants rate six dimensions on a 0 to 100 scale: mental demand, physical demand, temporal demand, performance, effort and frustration. You then combine the ratings into one workload score, either by weighting them with 15 pairwise comparisons (the original method) or by simply averaging them (Raw TLX, the version most UX teams use). A lower score means the task felt easier. The score is most useful for comparing two designs, or one design before and after a change, not as an absolute grade.
This guide explains each subscale, how to run and score the questionnaire, how to read the results, and how to pair the numbers with the reasons behind them.
Where the NASA-TLX comes from
Sandra Hart of NASA Ames Research Center and Lowell Staveland published the NASA-TLX in 1988, after several years of research into how pilots and crews experience workload. It was built for aviation, but it spread fast. In "NASA-Task Load Index (NASA-TLX), 20 Years Later" (Proceedings of the Human Factors and Ergonomics Society, 2006), Hart reviewed 550 studies that had used or examined it, and concluded that it had proved easy to use and reliably sensitive to the experimental changes researchers cared about. Its use had moved far beyond aviation and beyond English.

Today it shows up in medical device testing, automotive interfaces, control rooms, software usability studies and research on AI-assisted work. It is one of the most cited subjective workload measures there is.
The six subscales
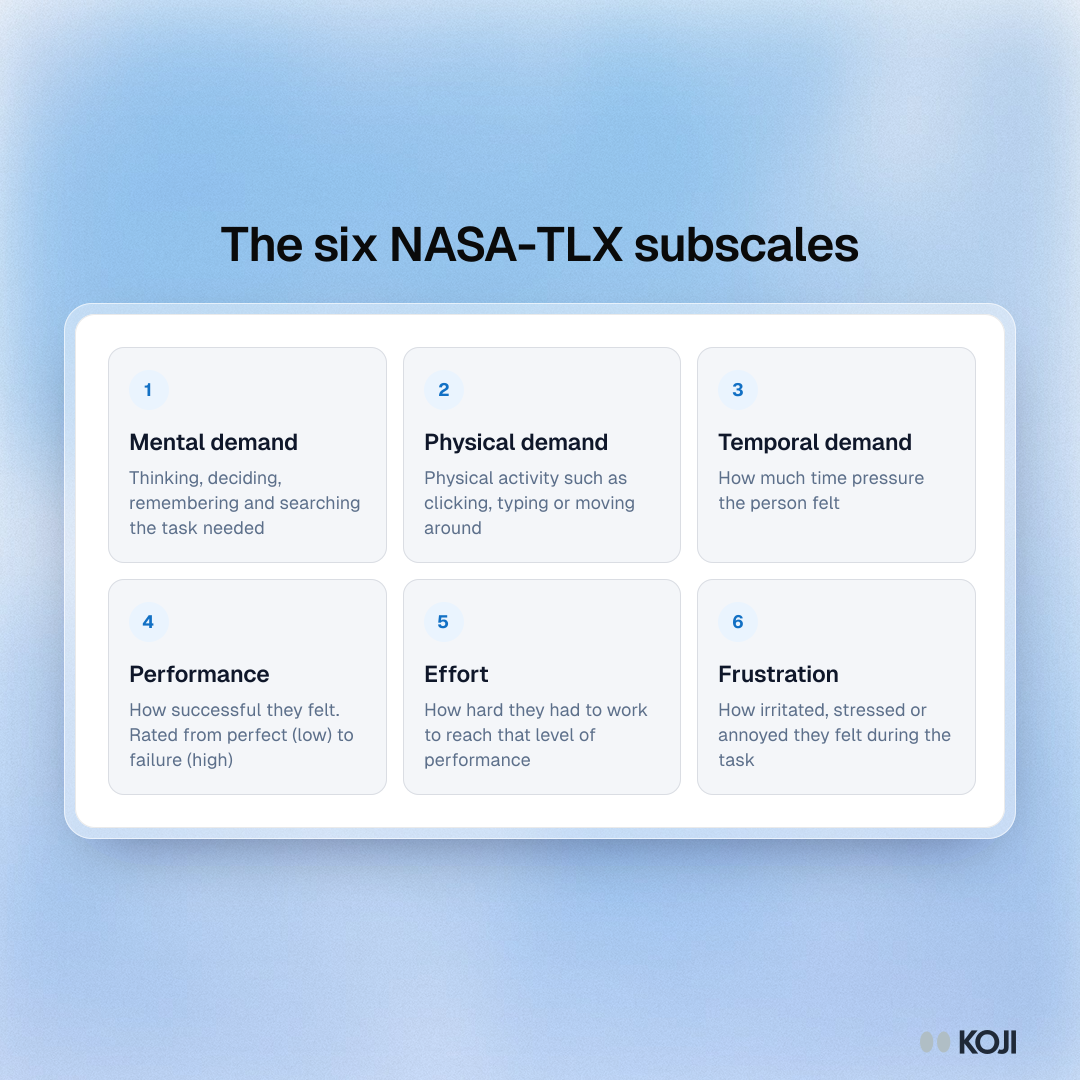
Each subscale has a definition that participants read before rating. Keep the definitions in front of them: the dimensions overlap in everyday language, and people rate more consistently when they know exactly what each word means.
| Subscale | The question it asks | Low end | High end |
|---|---|---|---|
| Mental demand | How much thinking, deciding, remembering or searching did the task need? | Very low | Very high |
| Physical demand | How much physical activity did it need, such as clicking, typing or moving? | Very low | Very high |
| Temporal demand | How much time pressure did you feel? | Very low | Very high |
| Performance | How successful were you in doing what you were asked? | Perfect | Failure |
| Effort | How hard did you have to work to reach your level of performance? | Very low | Very high |
| Frustration | How irritated, stressed or annoyed did you feel? | Very low | Very high |
Note the performance scale. It runs from "Perfect" on the left to "Failure" on the right, so that a high number always means more workload. Participants often get this wrong. Point it out, or your scores will be noisy.
How to run the NASA-TLX
- Define the task. One clear task per rating, such as "set up a new project and invite a teammate". Workload ratings for a whole session blur together.
- Give the questionnaire right after the task. Memory of effort fades quickly. Collect ratings within a few minutes.
- Show the definitions. Let participants read all six before they start.
- Collect the six ratings. The original scale has 21 marks from 0 to 100 in steps of 5. A 0 to 20 scale multiplied by 5 gives the same result.
- Optional: run the pairwise comparisons. For the weighted version, show the 15 possible pairs of subscales and ask which contributed more to the workload of this task.
- Ask why. One or two open questions about the highest-rated dimension turn a number into something a team can fix.
Scoring: weighted TLX vs Raw TLX
Weighted TLX
In the original method, each of the 15 pairwise choices adds one point to the subscale the participant picked. Each subscale ends up with a weight from 0 to 5, and the weights always sum to 15. The overall score is:
Workload = (sum of each rating × its weight) ÷ 15
The weights tell you which dimensions drove workload for that person on that task, which can be useful on its own.
Raw TLX
Raw TLX drops the pairwise step and takes the plain average of the six ratings. Hart's 2006 review discussed this shortened version, and many studies since have found it performs about as well as the weighted score while taking a fraction of the time. Most UX and product teams use Raw TLX, and unless you have a specific reason to need the weights, it is the sensible default.
Whichever you choose, use the same method for every condition you compare, and say which one you used when you report.
A worked example
A participant rates a checkout flow: mental 60, physical 20, temporal 45, performance 30, effort 55, frustration 50. The Raw TLX score is (60 + 20 + 45 + 30 + 55 + 50) ÷ 6 = 43.3.
After a redesign, the same task scores: mental 35, physical 20, temporal 30, performance 15, effort 30, frustration 20, a Raw TLX of 25. The overall drop matters, but the subscales show where it came from: mental demand, effort and frustration fell the most.
Reading the results
- Compare, do not grade. There is no official threshold for a "high" workload. A score of 40 might be excellent for an air traffic task and poor for a newsletter sign-up. Compare designs, versions or user groups on the same task.
- Look at the subscales, not only the total. Two designs with the same total can feel different: one mentally heavy, the other frustrating.
- Expect wide spread. Workload is personal. With small samples, report the median and the range, and do not over-read small differences.
- Pair it with behaviour. Task success, time on task and errors (see usability metrics) tell you what happened. TLX tells you what it cost the person.
NASA-TLX vs other post-task measures
| Measure | What it captures | Length | Best for |
|---|---|---|---|
| NASA-TLX | Perceived workload across six dimensions | 6 ratings, plus 15 pairs if weighted | Demanding or complex tasks, and comparing designs |
| Single Ease Question | Overall ease of one task | 1 rating | Quick checks after each task in a usability test |
| System Usability Scale | Usability of a whole product | 10 items | Overall product usability, after a session |
If you only need a quick ease rating after each of several tasks, the one-question approach is lighter. Use the TLX when the task is demanding enough that you need to know which kind of load is the problem. For product-level usability, see the System Usability Scale guide.
Getting the reasons behind the scores
A TLX score tells you a task felt mentally heavy. It does not tell you that people were hunting for a setting that is named differently from what they expected. That reason is what a team can act on.
Koji can collect both in one sitting. Run a short AI-moderated interview, by voice or text, straight after people try a task in your product:
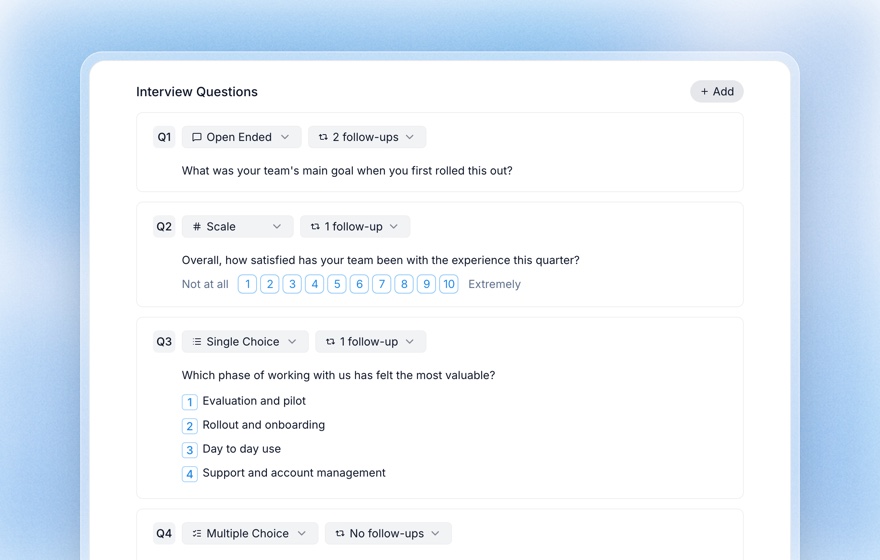
- Add the six ratings as scale questions. Koji supports custom scale ranges, so a 0 to 20 scale with the TLX anchors as labels works, and you multiply by 5 when you score. In text interviews, a wide range shows as a slider.
- Let the AI follow up on the ratings. You can set a scale question to probe, so a participant who rates frustration high is asked what caused it, in their own words. The structured questions guide covers the six question types and their follow-up settings.
- Read the scores and the reasons together. The report shows the distribution of each scale question next to the themes and quotes from the open answers.
Koji does not host the task itself, so give participants the task in your product or prototype first, then send them the interview link.
Common mistakes
- Rating the whole session. Ask after each task, or the ratings blend together.
- Forgetting the reversed performance scale. Explain it every time.
- Dropping subscales. Using only some of the six changes the measure. If physical demand never varies in your study, keep it anyway and say so.
- Reporting a single number. Always show the subscales.
- Comparing weighted and raw scores. They are not the same measure.
Related Resources
Related Articles
Structured Questions in AI Interviews
Mix quantitative data collection — scales, ratings, multiple choice, ranking — with AI-powered conversational follow-up in a single interview.
System Usability Scale (SUS): Complete Guide with Calculator, Benchmarks & Examples
The definitive 2026 guide to the System Usability Scale (SUS): the 10-question formula, scoring calculator, Sauro–Lewis benchmark grades, and how to deploy SUS at scale with AI-moderated interviews on Koji.
Usability Issue Severity Ratings: How to Score, Prioritize, and Report UX Problems (2026)
How to rate the severity of usability problems using Nielsen's 0-4 scale, why single-evaluator ratings are unreliable, how to separate severity from priority, and how to replace guessed frequency estimates with measured data.
Usability Metrics: Task Success Rate, Time on Task, and Error Rate Explained
The complete guide to the core usability metrics — task success rate, time on task, and error rate — including industry benchmarks, formulas, sample sizes, and how to capture them automatically with AI-moderated research.
How to Conduct Usability Testing: The Complete Guide
A comprehensive guide to usability testing for UX researchers and product managers. Covers types of testing, participant numbers, step-by-step facilitation, and the most common mistakes to avoid.
Usability Testing Questions: What to Ask Before, During, and After a Test
A complete bank of usability testing questions for the pre-test, in-task, and post-test phases, including screening, think-aloud probes, and standardized post-test metrics like SUS and SEQ.