Unipolar vs Bipolar Scales: How to Choose the Right Rating Scale
What unipolar and bipolar rating scales measure, the research on why polarity matters, and how to choose and label the right scale for each question.
The short answer: a unipolar scale measures how much of one quality is present, from none to a lot ("not at all satisfied" to "extremely satisfied"). A bipolar scale measures a position between two opposites, with a neutral middle ("very dissatisfied" to "very satisfied"). Choose by the thing you are measuring: if it has a natural zero, use a unipolar scale; if it has a natural opposite, use a bipolar one. Research by Jon Krosnick and colleagues suggests five points for unipolar scales and seven for bipolar ones, with every point labelled.
Getting polarity wrong is one of the most common hidden errors in survey design. The question looks fine, people answer it, and the numbers still mislead, because respondents read the scale differently from the way the analyst does.
What the two scale types measure
A unipolar scale has one pole and a zero point. It asks about the amount, frequency or intensity of something that can be absent but cannot go negative.
- How important is fast setup to you? Not at all important, Slightly, Moderately, Very, Extremely important
- How often do you export reports? Never, Rarely, Sometimes, Often, Always
- How confident are you in this result? Not at all confident ... Completely confident
A bipolar scale has two opposite poles and a midpoint that means neither. It asks about direction as well as strength.
- How satisfied or dissatisfied are you with onboarding? Very dissatisfied ... Neither ... Very satisfied
- Was the setup easier or harder than you expected? Much harder ... About the same ... Much easier
- Do you agree or disagree with this statement? Strongly disagree ... Neither ... Strongly agree
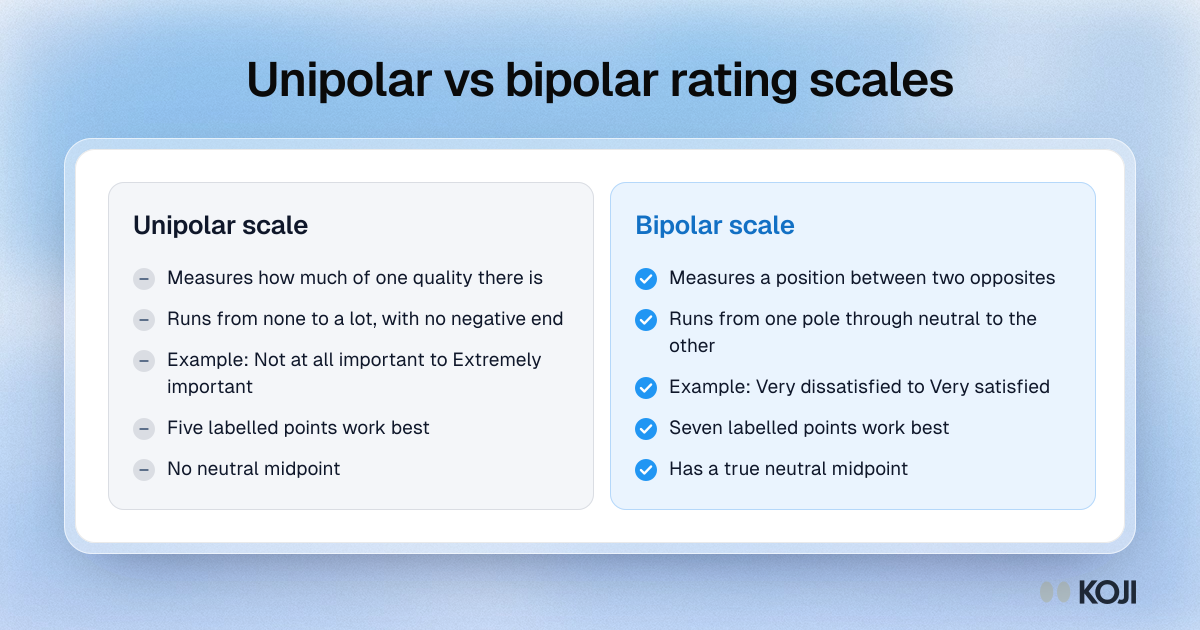
Survey methodologists do not fully agree on where the line falls. The GESIS survey guidelines by Natalja Menold and Kathrin Bogner (2016) note that there is no uniform definition of scale polarity in the literature, and give importance as an example that some frameworks treat as unipolar and others as bipolar. The practical test still works: ask whether the opposite of the top label is "none of it" or "the reverse of it".
Why polarity matters: the evidence
The numbers change what the labels mean. In a well-known experiment, Norbert Schwarz and colleagues asked a representative sample of German adults how successful they had been in life, on an 11-point scale from "not at all successful" to "extremely successful" ("Rating scales: Numeric values may change the meaning of scale labels", Public Opinion Quarterly, 1991). Only the numbers changed. When the scale ran from 0 to 10, 34% chose a value between 0 and 5. When it ran from -5 to +5, only 13% chose the equivalent values between -5 and 0. As the authors put it, respondents "use the numeric values to disambiguate the meaning of the scale labels." A 0 suggests absence of success, so the scale reads as unipolar; a -5 suggests failure, so it reads as bipolar, and people avoid the negative end.
The two types are not interchangeable. Jan Karem Höhne, Dagmar Krebs and Steffen-M. Kühnel asked the same income-inequality questions with unipolar and bipolar scales in a probability-based online panel (Social Science Computer Review, 2022). The response distributions differed significantly and the two versions were not measurement-invariant, so results from one cannot be compared directly with results from the other.
Each type has its best length. Krosnick and Tahk's 2008 meta-analysis drew on 706 reliability tests from 30 between-subjects studies. Five- and seven-point scales were generally the most reliable, but the best length depended on polarity: seven points for bipolar scales and five for unipolar ones. Offering a midpoint on a bipolar scale also increased reliability.
Labels matter as much as length. Duane Alwin's analysis of National Election Studies data, summarised in Survey Practice, compared fully labelled 7-point scales with ones labelled only at the ends. Reliability was .719 for the fully labelled scales against .506 for endpoint-only ones.
How to choose: a decision guide
Start with the construct, not the scale you used last time.
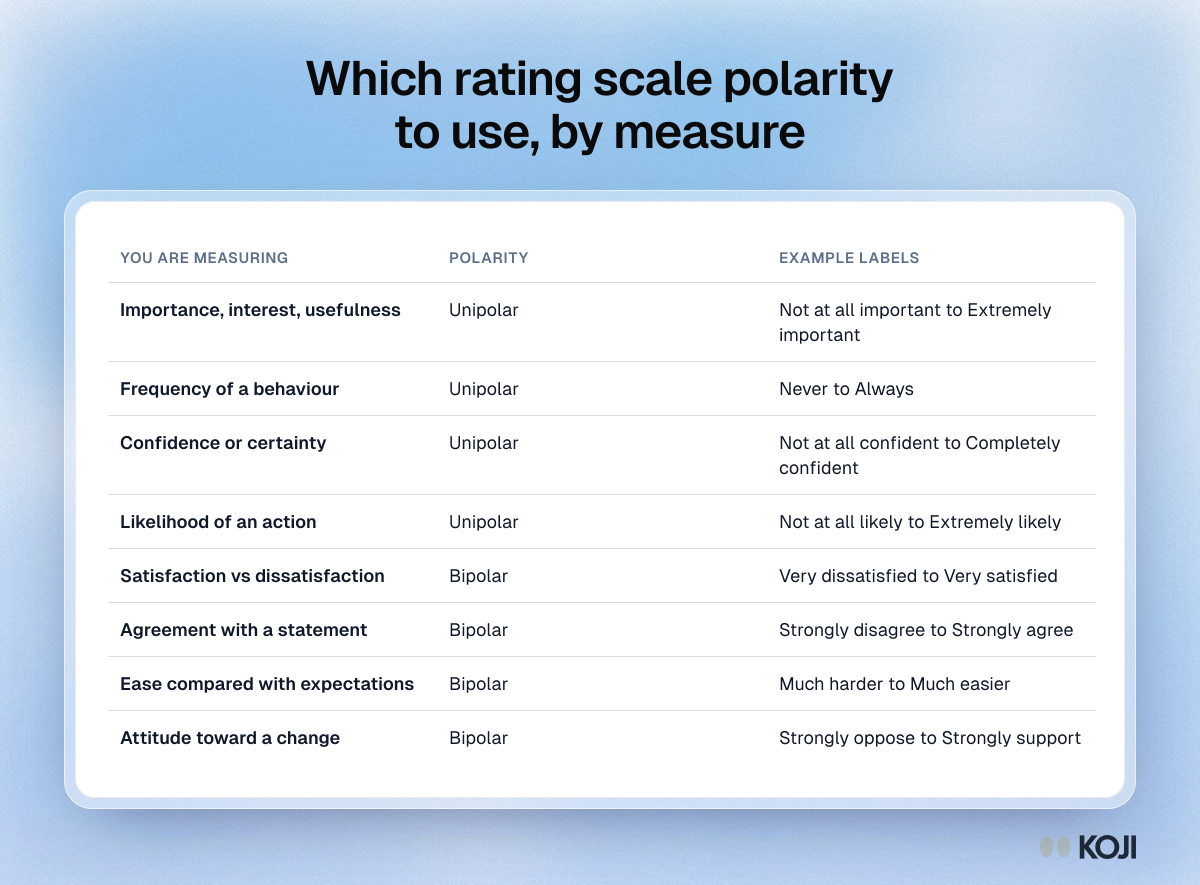
| You are measuring... | Polarity | Example labels |
|---|---|---|
| Importance, interest, usefulness | Unipolar | Not at all important to Extremely important |
| Frequency of a behaviour | Unipolar | Never to Always |
| Confidence or certainty | Unipolar | Not at all confident to Completely confident |
| Likelihood of an action | Unipolar | Not at all likely to Extremely likely |
| Satisfaction vs dissatisfaction | Bipolar | Very dissatisfied to Very satisfied |
| Agreement with a statement | Bipolar | Strongly disagree to Strongly agree |
| Ease compared with expectations | Bipolar | Much harder to Much easier |
| Attitude toward a change | Bipolar | Strongly oppose to Strongly support |
Some constructs can go either way, and the choice changes the question. "How satisfied are you?" with "Not at all satisfied" at the bottom is unipolar: it cannot tell a neutral customer from an angry one. "How satisfied or dissatisfied are you?" is bipolar and can. If you need to find unhappy customers, the bipolar version is the better tool.
Writing the labels
- Make the wording and the scale match. "How satisfied are you?" with "Very dissatisfied" at the bottom mixes the two. If the scale is bipolar, name both poles in the question: "How satisfied or dissatisfied...".
- Label every point where you can. The Alwin figures above are the reason.
- Keep labels evenly spaced. "Slightly, Moderately, Very, Extremely" reads as steady steps; "Okay, Good, Amazing" does not.
- Give bipolar scales a true midpoint such as "Neither satisfied nor dissatisfied". Don't use the midpoint to mean "I don't know"; offer that as a separate option if you need it.
- Do not put a midpoint on a unipolar scale. There is no neutral point between "not at all" and "extremely"; the lowest point already means none.
- Watch the numbers you show. Following Schwarz, a unipolar scale should start at 0 or 1, never at a negative number. If you number a bipolar scale, -3 to +3 signals the two poles clearly; plain 1 to 7 is also fine as long as the labels carry the meaning.
- Stay consistent within a study. If you want to compare items, give them the same polarity, length and labels.
Common mistakes
Using agree-disagree for everything. Agreement scales are bipolar and easy to write, so they end up measuring constructs that are really unipolar, like importance or frequency. They also invite acquiescence bias. Ask about the construct directly instead.
Reading a unipolar mean as a bipolar one. An average importance of 3 on a 1 to 5 scale means "moderately important", not "neutral". Reporting it as the middle of the road misleads stakeholders.
Switching polarity between waves. A tracking study that changes from "How satisfied are you?" to "How satisfied or dissatisfied are you?" has broken its trend line. Höhne and colleagues' finding that the two versions are not measurement-invariant is exactly why.
Treating NPS as bipolar. The likelihood-to-recommend question runs from 0 ("not at all likely") to 10 ("extremely likely"). It is unipolar. Detractors are not people who would argue against you; they are people unlikely to recommend you.
Pretest the scale with real people
The quickest way to catch a polarity problem is to watch real respondents use the scale. In a short pilot, ask a handful of people to answer and then explain their choice out loud: "Why a 2 and not a 3? What would a 1 mean to you?" If people describe the bottom of a unipolar scale as "I hated it", or the middle of a bipolar one as "I didn't really use it", the labels are not doing their job. This is a small version of cognitive interviewing, and it often takes less than an hour.

Photo by Christin Hume on Unsplash
How Koji helps
Koji's AI interviews mix rating scales with open conversation, which makes polarity problems easier to spot and the scores easier to interpret.
- Configurable scale questions. Add a scale question to a study, set its range and label the ends, so you can build a 1 to 5 unipolar importance scale or a 1 to 7 bipolar satisfaction scale. Participants answer with buttons in text interviews and out loud in voice interviews. See the structured questions guide.
- A follow-up after every score. Scale questions can ask an anchored follow-up, such as "You said 3. What would change that?", so every number comes with the reason behind it. That is a built-in check on whether people read the scale the way you meant.
- Distribution charts in the report. Each scale question gets its own distribution in the report, next to the themes from the open answers, so you can see whether low scores really mean dissatisfaction or just low use.
- Free previews. Take your own interview before launch to check the wording and labels; previews never use credits or count as responses.
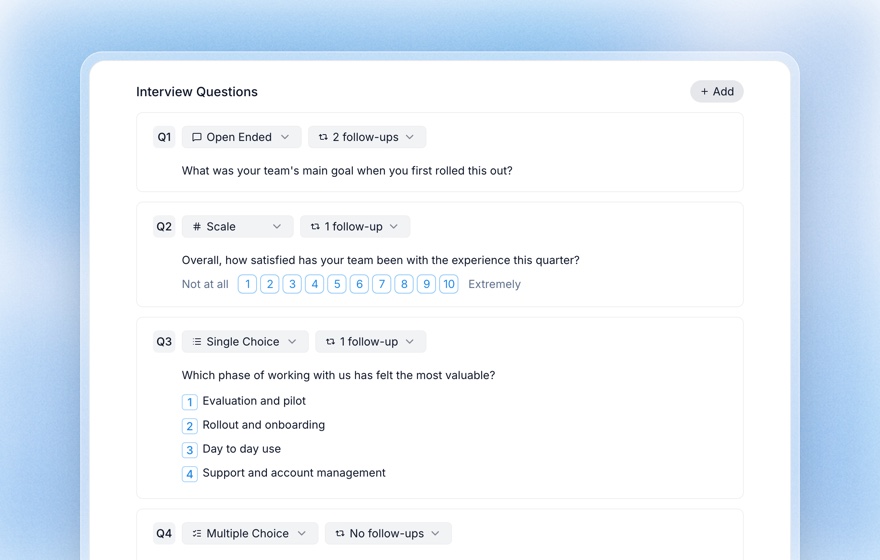
Compared with a traditional survey tool, the main difference is the follow-up. A form tells you how many people chose 2. An interview that asks why tells you whether those people were mildly unhappy or simply uninterested, which is the distinction polarity is meant to capture in the first place.
Related Resources
- Likert scale questions
- 5-point vs 7-point Likert scales
- Semantic differential scale
- Scale questions in AI interviews
- Questionnaire design guide
- Structured questions guide
Sources
- Norbert Schwarz, Bärbel Knäuper, Hans-J. Hippler, Elisabeth Noelle-Neumann and Leslie Clark, "Rating scales: Numeric values may change the meaning of scale labels", Public Opinion Quarterly 55(4), 1991.
- Jan Karem Höhne, Dagmar Krebs and Steffen-M. Kühnel, "Measuring Income (In)equality: Comparing Survey Questions With Unipolar and Bipolar Scales in a Probability-Based Online Panel", Social Science Computer Review, 2022.
- Jon A. Krosnick and Alexander Tahk, meta-analysis of scale length and reliability, 2008, as summarised in Survey Practice, "How many scale points should I include for attitudinal questions?".
- Duane F. Alwin, Margins of Error: A Study of Reliability in Survey Measurement, Wiley, 2007, as summarised in Survey Practice, "Should I label all scale points or just the end points for attitudinal questions?".
- Natalja Menold and Kathrin Bogner, "Design of Rating Scales in Questionnaires", GESIS Survey Guidelines, 2016.
Related Articles
5-Point vs 7-Point Likert Scale: How Many Scale Points Should You Use? (2026)
A decision guide for rating-scale length — what the reliability research actually says about 5 vs 7 points, the odd-vs-even and neutral-midpoint debates, when each fits, and how AI follow-ups make any scale richer.
Likert Scale Questions: How to Use Rating Scales in User Research
A complete guide to Likert scale questions in user research — what they are, when to use them, how to write them correctly, and how Koji's AI interviews take rating scales further by pairing quantitative scores with qualitative follow-up.
Questionnaire Design: The Complete Guide to Writing Questions That Get Honest Answers
A research-backed guide to questionnaire design — defining your constructs, writing unbiased questions, choosing response scales, ordering for flow, pre-testing, and avoiding the biases that quietly ruin your data.
Scale Questions in AI Interviews: Measure NPS, CSAT, and Ratings Automatically
Learn how to configure and use scale questions in Koji AI interviews to capture NPS, CSAT, and satisfaction ratings — with automatic probing and aggregated distribution charts in your research report.
Semantic Differential Scale: The Complete Guide to Measuring Perception
A complete guide to the semantic differential scale — how Osgood's bipolar-adjective method works, when to use it for brand and concept perception, how it differs from a Likert scale, and how to build and analyze one with examples.
Structured Questions in AI Interviews
Mix quantitative data collection — scales, ratings, multiple choice, ranking — with AI-powered conversational follow-up in a single interview.