Purchase Intent Scale: How to Ask "Would You Buy This?" and Read the Answer
How the 5-point purchase intent scale works, how to score it as top-box or top-2-box, what the research says about when intent predicts sales, the 11-point Juster probability scale and how to pair the score with the reasons behind it.
A purchase intent scale asks people how likely they are to buy something, usually on five labelled points from "Definitely would not buy" to "Definitely would buy". Researchers report the top-box (share choosing "Definitely") or top-2-box (share choosing "Definitely" or "Probably") score and compare it across concepts, prices or segments. Used that way, as a relative measure, it works well. Used as a sales forecast, it needs care: four decades of research show stated intent tracks real buying, but loosely, and much more loosely for new products than for familiar ones.
This guide covers the standard question wording, how to score it, the evidence on when intent predicts behaviour, the 11-point purchase probability alternative, and how to pair the number with the reasons behind it.
The standard purchase intent question
The classic version, used in concept tests for decades, looks like this:
Based on what you have just seen, how likely would you be to buy this product?
- Definitely would buy
- Probably would buy
- Might or might not buy
- Probably would not buy
- Definitely would not buy
A few details make it work:
- Show the thing first. Purchase intent is a reaction to a specific concept: a description, a mockup, a package, a landing page. Ask it right after the stimulus, before any questions that could prime the answer.
- Name the price when price matters. "How likely would you be to buy it at €19 a month?" is a different question from "How likely would you be to buy it?". Without a price, people tend to answer about the idea, not the purchase.
- Keep the five labels. Each point is a verbal statement, not a number, so people don't have to translate a feeling into a digit. The middle point, "Might or might not", is a real answer, not a dodge.
- Ask it once per concept. If you show several concepts to the same person, rotate the order so no concept always goes first. Monadic testing avoids the comparison problem entirely by showing each person one concept.
How to score it
There are three common ways to summarise the answers:
| Score | What it counts | When to use it |
|---|---|---|
| Top-box | Share answering "Definitely would buy" | Comparing strong concepts, where most people say at least "Probably" |
| Top-2-box | Share answering "Definitely" or "Probably" | The default for concept screening and price tests |
| Mean score | Average on a 1 to 5 coding | Tracking small changes between waves, with care (see averaging Likert data) |
Top-2-box is the most common. It is easy to explain ("38% would probably or definitely buy") and less noisy than the top box alone. The trade-off is that it treats a lukewarm "Probably" the same as an enthusiastic "Definitely".
Whatever you choose, keep it fixed across the concepts or waves you compare. The score is most useful as a comparison: concept A against concept B, this price against that one, new customers against existing ones. On its own, "41% top-2-box" means little until you know what a typical concept in your category scores.
When purchase intent predicts real buying
Stated intent and actual purchases are linked, but not one to one. Vicki Morwitz, who has studied the question for most of her career, summarised 60 years of research in one line: "Purchase intentions are correlated and predict future sales, but do so imperfectly" (Morwitz, 2014).
How imperfect depends on what you are measuring. In a meta-analysis, Morwitz, Steckel and Gupta (2007) found intentions are more strongly correlated with purchases:
- for existing products than for new products
- for durable goods than for non-durables
- over short time horizons than long ones
- when the question is about a specific brand rather than a whole category
- when predicting trial rather than total market sales
- when intentions are collected in a comparative mode
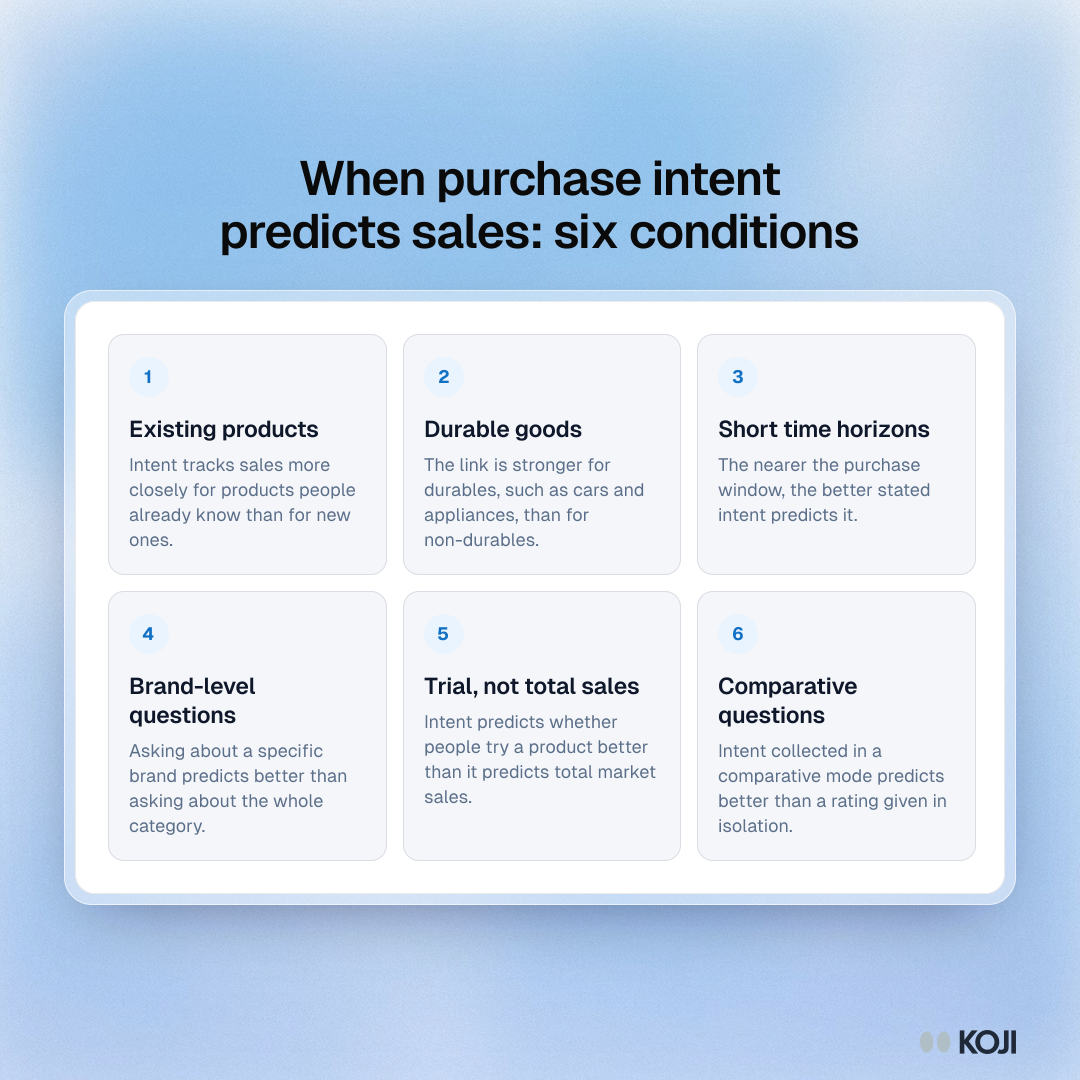
Read the list against a typical startup concept test: a new product, often a subscription (non-durable), asked about months before launch. That is close to the worst case on almost every line. It doesn't make the data useless. It means the number is a ranking tool, not a revenue forecast.
There is good news for familiar products. Armstrong, Morwitz and Kumar (2000) tested four intentions-based forecasting methods on French car sales, two US car sales series and US wireless subscriptions. Every method beat a simple extrapolation of past sales, and combining them gave errors about one-third lower than extrapolation alone.
Asking changes the answer
One more effect to know about. Chandon, Morwitz and Reinartz (2005) ran three large field studies comparing consumers who were asked about their intentions with similar consumers who were not. The link between underlying intentions and later purchases was, on average, 58% stronger among the people who had been surveyed. Being asked appears to make people more likely to act in line with what they said.
That matters in two ways. Surveyed customers are not a perfect stand-in for customers who were never asked, so a forecast built on them can run high. And if you survey your own customers about a product, the survey itself may nudge some of them towards it. Later critics have argued that part of the 58% may come from the study's method, so treat the size as uncertain and the direction as the lesson.
The 11-point purchase probability scale
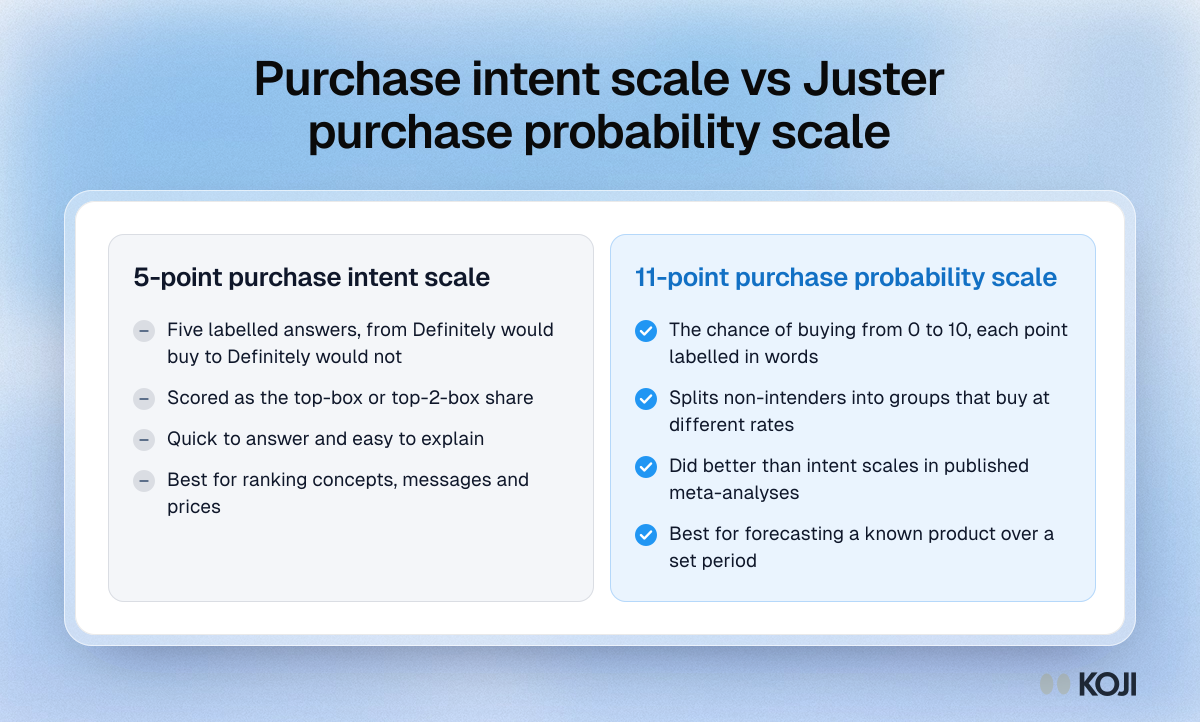
The main alternative is the purchase probability scale developed by economist F. Thomas Juster and published by the NBER in 1966. Instead of five intent statements, it asks people to rate the chance they will buy on 11 points, from 0 to 10, with each point labelled as a probability in words, from "no chance" up to "certain".
Juster's argument was that intent questions miss the people who say they have no plans to buy but buy anyway. A probability question splits those non-intenders, and the "don't knows", into groups with clearly different purchase rates. In his car-buying data, the probability question explained roughly twice as much of the variation in purchase rates between households as the intentions question did.
The evidence backs him up. In two meta-analyses of published studies, Wright and MacRae (2007) concluded that "purchase intention scales are empirically unbiased" across those studies, with less variability than previously assumed, and that purchase probability scales performed even better.
So which should you use?
- Use the 5-point intent scale to compare concepts, messages and prices against each other, and in price tests where each answer is a buy or no-buy decision. It is familiar, quick and easy to explain.
- Use the 11-point probability scale when you need an actual estimate of how many people will buy within a set period, for a product people already understand, and you can say what the period is ("in the next 3 months").
Common mistakes
- Treating the top-2-box score as the sales forecast. If 40% say they would probably or definitely buy, don't plan for 40% to buy. Use the score to rank options, then check the winner against behaviour: a pre-order, a waitlist, a fake door test or a letter of intent.
- Asking without a price. People rate the idea, not the trade. Add the price, or use a Gabor-Granger price test that asks at several prices.
- Asking people who could never buy. Screen for the people who make or influence this purchase. A high intent score from people with no budget is noise.
- Reading the number without the reasons. A 30% top-2-box score might come from a weak concept or from a strong concept with one fixable objection. The number alone can't tell you which.
- Comparing across studies with different wording. Change the labels, the stimulus or the order of questions and the scores are no longer comparable.
Pair the score with the reasons
The most useful thing you can add to a purchase intent question is a follow-up: "What makes you say that?" asked straight after the answer. It turns a score into a decision. People who say "Probably would buy" often name exactly what would move them to "Definitely": a missing feature, a price that feels one step too high, a doubt about switching. People who say "Might or might not" tell you whether they misunderstood the concept or understood it and didn't care.
This is also where the gap between stated intent and behaviour gets easier to manage. When you can read why someone said "Definitely", you can tell the excited buyer from the polite one. The stated vs revealed preferences guide covers how to check those answers against what people actually do.
Running a purchase intent study with real people
A practical setup for a founder or product team:

Photo by Federico Garcia on Unsplash
- Write one clear concept. A short description, an image of the product or landing page, and the price.
- Recruit 30 or more people per concept from the audience who would actually buy. Fewer than that and the differences between concepts are mostly noise.
- Ask the 5-point intent question right after the concept, then "What makes you say that?"
- Ask what they would do instead if this product didn't exist. It tells you what you're competing with.
- Report top-2-box by concept and by segment, next to the three or four most common reasons for each answer.
- Validate the winner with behaviour before you build or reprice.
How Koji helps
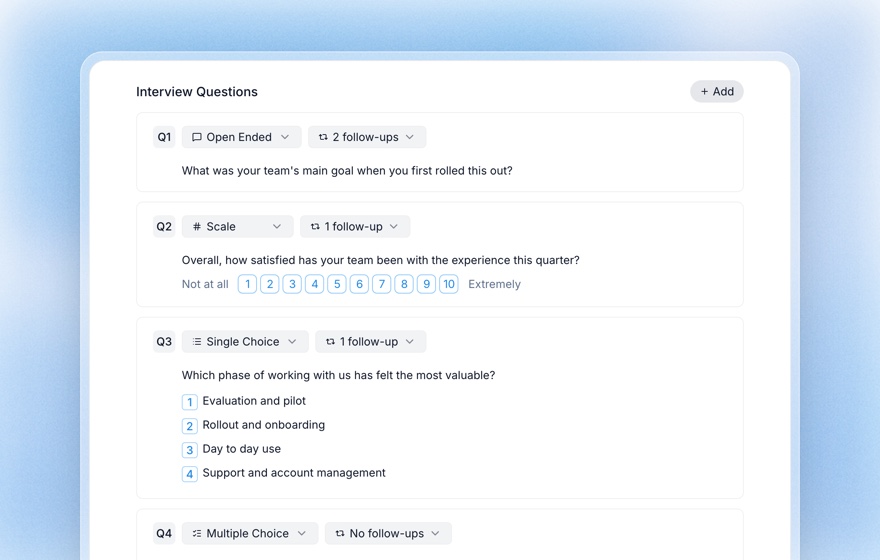
Koji runs AI-moderated interviews by voice or text, so every rating comes with a conversation behind it.
- Price tests with a purchase intent scale. Koji's Price Test (Gabor-Granger) question uses the 5-point scale above, from "Definitely would buy" to "Definitely would not buy", at one price at a time. You set which answer counts as a buy; the default is "Probably would buy" or higher, which is top-2-box. Each person starts at a random price in the middle of your ladder, so nobody anchors on the cheapest one, and Koji moves up or down until it finds the highest price they would still buy at, usually in about three steps.
- The reasons behind every answer. After the price test, Koji asks why in the participant's own words, and its follow-up questions (from none to three per question, your choice) dig into what would change the answer.
- Show the concept. Attach an image to any question, such as a mockup, an ad or a landing page, so participants react to the real thing and Koji's follow-ups are about what they saw.
- A probability scale when you need one. Scale questions can run from 0 to 10 with your own labels at both ends, which covers an 11-point purchase probability question.
- A report that keeps the quotes. For a price test, the report shows the share who would buy at each price, the revenue each price implies and the price that earns the most, with the quotes behind each point. It is labelled directional, for the reasons covered above. It reads best from about 30 interviews.
You can set up a study yourself from a free account, next to every other kind of question, or ask the research assistant to "help me test pricing for" your product.
Related Resources
- Good-Better-Best Pricing Research: test pricing tiers as a lineup
- Logo Testing: test a new brand mark before you launch it
- Gabor-Granger pricing method
- Van Westendorp price sensitivity meter
- Concept testing methodology
- Stated vs revealed preferences
- 5-point vs 7-point Likert scale
- Structured questions guide
Sources
- Armstrong, J. S., Morwitz, V. G., & Kumar, V. (2000). Sales forecasts for existing consumer products and services: Do purchase intentions contribute to accuracy? International Journal of Forecasting, 16(3), 383–397.
- Chandon, P., Morwitz, V. G., & Reinartz, W. J. (2005). Do intentions really predict behavior? Self-generated validity effects in survey research. Journal of Marketing, 69(2), 1–14.
- Juster, F. T. (1966). Consumer Buying Intentions and Purchase Probability: An Experiment in Survey Design. National Bureau of Economic Research.
- Morwitz, V. G. (2014). Consumers' purchase intentions and their behavior. Foundations and Trends in Marketing, 7(3), 181–230.
- Morwitz, V. G., Steckel, J. H., & Gupta, A. (2007). When do purchase intentions predict sales? International Journal of Forecasting, 23(3), 347–364.
- Wright, M., & MacRae, M. (2007). Bias and variability in purchase intention scales. Journal of the Academy of Marketing Science, 35, 617–624.
Related Articles
5-Point vs 7-Point Likert Scale: How Many Scale Points Should You Use? (2026)
A decision guide for rating-scale length — what the reliability research actually says about 5 vs 7 points, the odd-vs-even and neutral-midpoint debates, when each fits, and how AI follow-ups make any scale richer.
Concept Testing: The Complete Methodology Guide
How to evaluate product and marketing ideas with target audiences before development — covering methods, metrics, sample sizes, and AI-powered approaches.
Gabor-Granger Pricing Method: Find Your Revenue-Maximizing Price
A practical guide to the Gabor-Granger pricing method — how it works, a worked revenue-curve example, its limitations, how it compares to Van Westendorp and conjoint, and how to run it with AI.
Good-Better-Best Pricing: How to Research Your Tiers Before You Launch Them
How to research tiered pricing: why three tiers work, how decoy and compromise effects change which tier people choose, a six-step method for features, prices and the full lineup, the questions to ask and the common mistakes.
Logo Testing: How to Test a Logo With Real People Before You Commit
How to test a logo with your target audience: what a logo test can and cannot tell you, the five measures that matter, a step-by-step method with a timed first look, a reusable question bank, sample sizes and common mistakes.
Stated vs. Revealed Preferences: Why Customers Say One Thing and Do Another (2026)
Customers routinely say one thing and do another — the say-do gap. This guide explains stated vs. revealed preferences, why the gap exists, what the data shows about its size, and how to design research that gets past what people claim to what they actually do.
Structured Questions in AI Interviews
Mix quantitative data collection — scales, ratings, multiple choice, ranking — with AI-powered conversational follow-up in a single interview.
Van Westendorp Price Sensitivity Meter: The Four-Question Pricing Research Method
The Van Westendorp Price Sensitivity Meter uses four questions to identify the optimal price for any product. Learn how to run the PSM with AI interviews at scale and combine the four numbers with qualitative reasoning.