Comparison
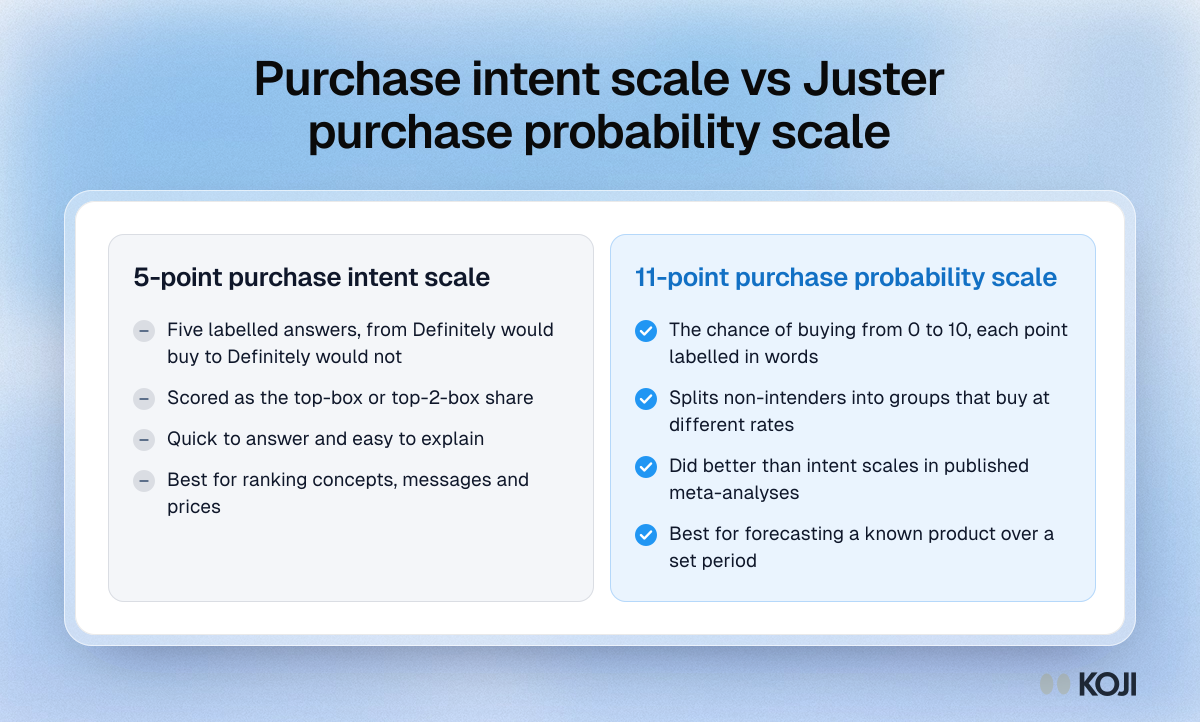
Purchase intent scale vs Juster purchase probability scale
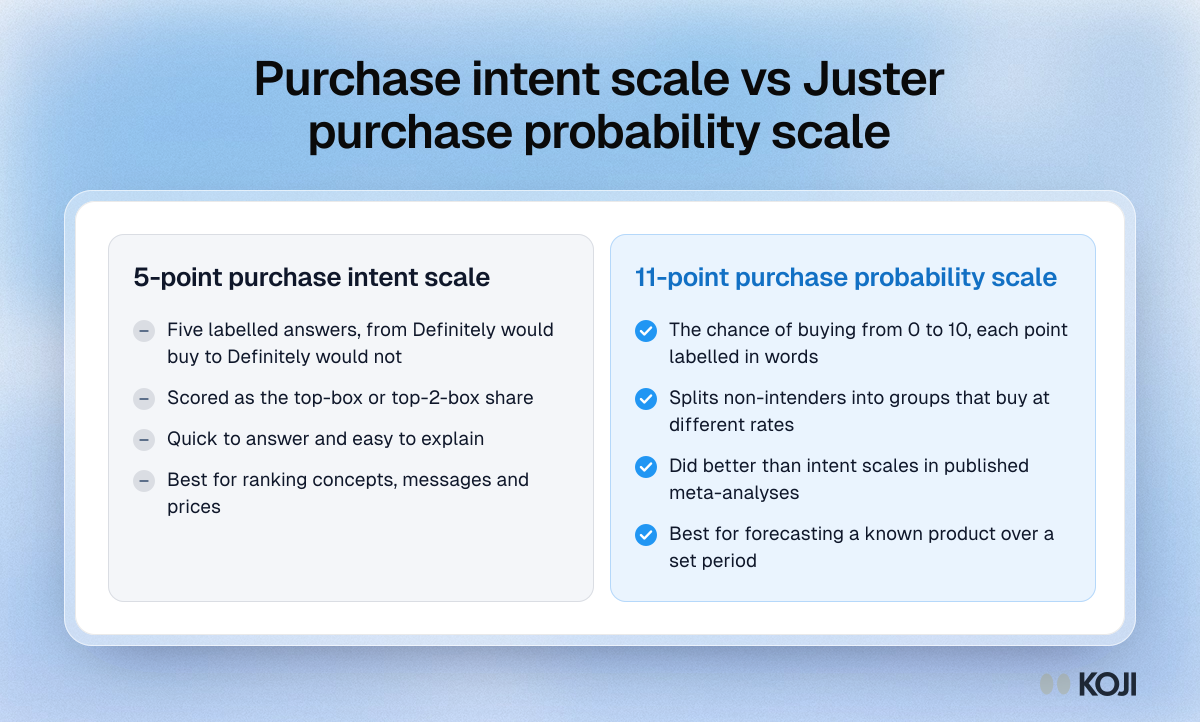
A side by side comparison of the two common ways to ask whether someone will buy: the 5-point purchase intent scale scored as top-box or top-2-box, and the 11-point purchase probability scale F. Thomas Juster published in 1966. It is for researchers choosing a question for a concept test, price test or demand forecast. The evidence on probability scales comes from Wright and MacRae's 2007 meta-analyses.
Where this appears
What's in this comparison
5-point purchase intent scale
- Five labelled answers, from Definitely would buy to Definitely would not
- Scored as the top-box or top-2-box share
- Quick to answer and easy to explain
- Best for ranking concepts, messages and prices
11-point purchase probability scale
- The chance of buying from 0 to 10, each point labelled in words
- Splits non-intenders into groups that buy at different rates
- Did better than intent scales in published meta-analyses
- Best for forecasting a known product over a set period
Use this image
Free to use in your docs, decks and posts under CC BY 4.0, as long as you credit Koji with a link to this page. To embed it, paste this into your page:
html
<a href="https://www.koji.so/visuals/purchase-intent-scale-vs-juster-probability-scale"><img src="https://www.koji.so/visuals/purchase-intent-scale-vs-juster-probability-scale/purchase-intent-scale-vs-juster-probability-scale.png" alt="Comparison of the 5-point purchase intent scale and the 11-point Juster purchase probability scale, with what each is best for" width="1200" height="722" /></a>
<p>Source: <a href="https://www.koji.so/visuals/purchase-intent-scale-vs-juster-probability-scale">Purchase intent scale vs Juster purchase probability scale</a>, Koji</p>